|
|||
Inflation, Manipulation, and Long-Term Market TrendsSteve Saville
Paul Volcker is often given credit for ending the inflation that ravaged the US economy during the 1970s, and yet the following chart shows that there was a sharp INCREASE in the year-over-year M2 growth rate (the inflation rate) during the first 4 years of his tenure as Fed Chairman. It's therefore not true that Volcker ended the inflation, which begs the question: why is he generally given credit for doing so? 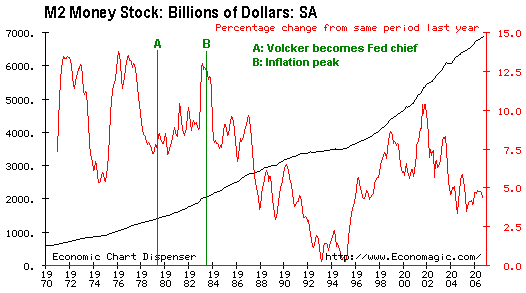 Volcker is widely heralded as the man who defeated inflation because during his first 12 months as Fed chairman the main focus of inflation began to shift from physical assets such as gold to financial assets such as stocks and bonds. That is, shortly after he became Fed Chief the inflation began to manifest in ways that most people do not associate with an inflation problem. As long as financial asset prices are the ones doing most of the rising hardly anyone will link the rising prices to inflation, let alone consider them to be evidence of an inflation PROBLEM. It is only when gold and commodities are the main beneficiaries of inflation that people worry about an inflation problem. Which leads us to the question: why did the focus of inflation begin to shift from physical assets to financial assets during the first year of Volcker's chairmanship? There were, we think, a number of reasons, including the greater confidence inspired by the combination of a Volcker-led Fed and a Reagan-led government, but in our opinion the key factor was valuation: investments that tend to benefit from the perception of a burgeoning inflation problem had become extremely over-priced relative to investments that tend to benefit from the perception of a benign inflation environment. That is, the inflation trade had become way too popular with the investing public, bringing into play the "principle of ever-changing cycles"*. For example, at one point in 1980 the Dow Industrials Index was lower, relative to gold, than it had been at the bottom of the 1929-1932 bear market. With gold at a 60-year high relative to the Dow, with the average US stock having a dividend yield of more than 6% and a P/E ratio of well below 10, and with 10-year Treasury Notes yielding 13%, the markets were primed for major trend reversals. Note that governments and central banks sold a lot of gold during the second half of the 1970s in an effort to change the trends in the markets, but to no avail. The trends continued, with the occasional interruption, until extremes of under/over-valuation were reached. Moving ahead to 2000 we find the markets again primed for major trend reversals, but this time with gold at an all-time low relative to the Dow and with the average US stock being valued at around 25-times earnings. Major trend reversals again occurred, with a secular bull market in gold getting underway at the same time as a secular bull market in equities was ending (see chart below). Once again the trends reversed after extremes of under/over-valuation were reached. 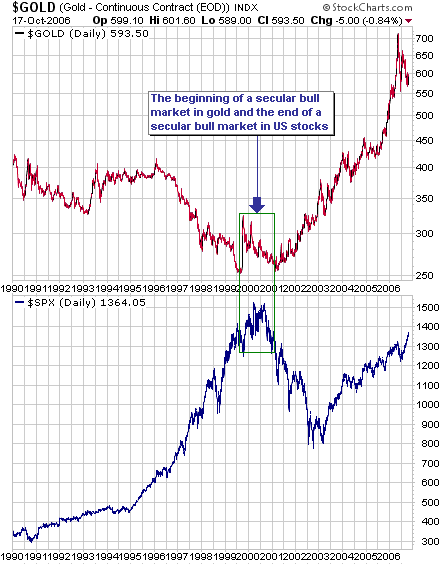 On a related matter there's a theory that central banks have tried to suppress the gold price over the past 15 years by lending gold into the market, but regardless of whether this theory is right or wrong it is irrelevant from an investment perspective. We don't know the motivation for the large-scale lending of gold by central banks, but even if we make the assumption that the lending has been done with the aim of keeping a lid on the gold price it is clear that, as was the case with the large-scale gold selling by the official sector during the 1970s, it hasn't altered the long-term trends in the markets. As illustrated by the above chart, a new long-term bull market in gold began exactly when it SHOULD have begun: shortly after the end of the long-term bull market in US equities. As far as forecasting the gold price was concerned, the biggest challenge during the late-1990s was figuring out when the stock market bubble was going to burst. Bubbles, by their nature, tend to go on for much longer than a rational observer expects, and this was certainly the case for the US stock market bubble. The thing about central bank gold lending is that it will only ever be possible for central banks to lend gold into the market when there are willing borrowers of the gold; and the quantity of willing gold-borrowers in the marketplace will move inversely to the quantity of market participants who think gold is in a bull market (the more people who think gold is in a bull market the smaller will be the pool of potential gold borrowers). This is because a potential gold borrower may well be interested in borrowing gold if he/she expects to be able to repay the loan with cheaper gold in the future, but if he/she believes that gold has a good chance of being more expensive in the future then the idea of borrowing gold will be a lot less appealing. In other words, the large-scale lending of gold by central banks was a function of the long-term bear market in gold; it was not a cause of it. It undoubtedly exacerbated the downward trend, but the downward trend had to have already been in force in order for the lending/borrowing of gold to become popular. A good example of how the behaviour of gold borrowers changes in response to changes in price trends is provided by Barrick Gold. Barrick, via its huge forward-sales book, was an important facilitator of central bank gold lending during the 1990s and the early part of the current decade. However, as soon as Barrick's management began to suspect that gold had embarked on a bull market it began to scale-out of the massive gold short position that had been built-up under the guise of hedging; tentatively at first and then aggressively as the bullish trend became more blatant. From being an 'exacerbator' of gold's downward trend during the 1990s Barrick has, over recent years, been an 'exacerbator' of gold's upward trend. In summary: long-term trends end after valuations reach extremes and not a moment before, regardless of the attempts of governments to manipulate the trends to their own advantage. Furthermore, the fact that there is so much inflation under the current monetary system has resulted, and will continue to result, in markets reaching even greater valuation extremes prior to major trend reversals taking place. *After the public becomes totally convinced that the future trend is going to be in one direction and bets accordingly the weight of its betting changes the odds to the point where the probability of these bets paying-off becomes exceedingly low. The public's enthusiasm for a particular type of investment or investing strategy therefore paves the way for the cycle to change and for a very different investment type or investing strategy to come to the fore. Steve Saville Regular financial market forecasts and analyses are provided at our web site: We aren't offering a free trial subscription at this time, but free samples of our work (excerpts from our regular commentaries) can be viewed at: http://tsi-blog.com Saville Archives 321gold Inc |
