The 1973 Model
Steve Saville
email: sas888_hk@yahoo.com
Jul 1, 2008
Below is an extract from
a commentary originally posted at www.speculative-investor.com
on 29th Jun, 2008.
Since early this year we've been using the performances of various markets during 1973 as a rough guide to what we should expect over the course of this year. Using 1973 as a model has made sense to us for a number of reasons. First, the equity, gold and currency markets have appeared to be in similar situations in the present as they were back then. For example, the January-1973 stock market peak was the top of a cyclical bull market within a secular bear market, and is, in our view, comparable to the October-2007 stock market peak. Second, there was an obvious inflation problem during the early 1970s as there is now, with few people recognising the source of the problem (the source was/is monetary, but the focus of attention was/is on the rising prices of food and energy as if these rising prices were the disease rather than just a symptom). And third, as was the case in 1973 the US economy is now in the early stages of a recession.
The 1973 Model has not only made sense, thus far it has been as close to the mark as could reasonably be expected given that no two market cycles will ever be identical. We'll further explain what we mean with the aid of the following Dow Industrials chart covering the period from the beginning of 1973 through to the end of 1974.
The Dow peaked in January of 1973 and then slid to an initial bottom about 4 months later (Point A). The short-term bottom labeled "A" doesn't look like much on our chart, but it was a major selling climax in that it was marked by a single day on which there were more than 1100 new lows on the NYSE. This makes the May-1973 interim low similar to the 22nd January-2008 interim low (there were also more than 1100 new NYSE lows on 22nd January).
The Dow then tested its May-1973 low about two months later (Point B on the chart), in similar fashion to the way it tested its January-2008 low about two months later. In other words, we think Point B on the 1973-1974 chart is equivalent to 17th March of this year. A recovery then got underway, and although the Dow dropped to a marginal new low in August of 1973 (Point C) the recovery continued until late October (Point D). A sharp decline then began, which culminated at a new low for the year in early December (Point E).
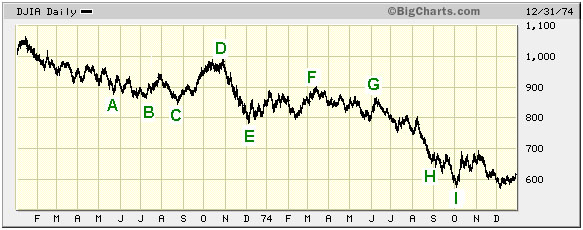
We don't expect today's market to mimic every twist and turn of the 1973 market. However, by comparing today's market with the 1973 market we hope to get a general idea of what could lie ahead. In other words, it isn't necessary, or even desirable, for us to make every point on the 1973 chart correspond with a point on a chart showing the current situation.
That being said, we are wondering if the recovery that began in March of this year is over, in which case it may be reasonable to equate the May-2008 rebound high with Point D on the 1973 chart, or if, instead, the current market is now close to the equivalent of Point C. Under either of these scenarios the market would be close to a short-term bottom, so in this respect it would make very little difference whether the Dow was currently near the equivalent of Point C or Point E. It would, however, make a big difference to the expected performance of the gold sector over the coming three months. To help explain why, we've included, herewith, a chart of the Barrons Gold Mining Index (BGMI) covering the same period as the above Dow chart. Point A on the BGMI chart is the same as Point A on the Dow chart, etc.
The BGMI's downward reversal in July of 1973 (Point B) substantiates our opinion that the July-1973 stock market low can be equated with the March-2008 low. The question is whether the markets are now approaching the equivalent of Point C or the equivalent of Point E. In the former case the gold sector has 1-2 months of additional corrective activity ahead of it, whereas in the latter case the gold sector is about to experience a multi-month surge to well above its March-2008 high.
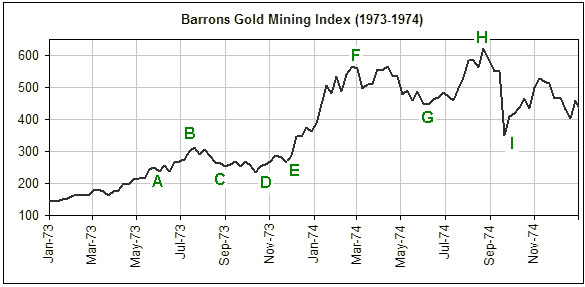
Due to the upside breakouts in the gold-stock indices that occurred during the final two days of last week, the odds favour the idea that the markets are now approaching the equivalent of Point E.
Steve Saville
 email: sas888_hk@yahoo.com email: sas888_hk@yahoo.com
Hong Kong Regular financial market forecasts and analyses are provided at our web site:
http://www.speculative-investor.com/new/index.html. We aren't offering a free trial subscription at this time, but free samples of our work (excerpts from our regular commentaries) can be viewed at: http://tsi-blog.com
Copyright ©2002-2019 speculative-investor.com All Rights Reserved. Saville Archives
321gold Ltd

|
