 Blue in the
face. . . Blue in the
face. . .
Richard Russell
Dow Theory Letters
September 13, 2005
Extracted
from the September 12, 2005 edition of Richard's Remarks
I've talked
about the dollar until I'm blue in the face. After all, most
of what we own and all of what we work for -- is denominated
in those Federal Reserve Notes that we call dollars. Make no
mistake about it, the dollar is a "fantasy currency."
There exists no definition of the dollar. The dollar today can
only be defined in its relationship with other currencies. A
dollar is worth this much in terms of euros, a dollar is worth
this much in terms of yen.
All right,
then what makes the dollar worth anything at all? Confidence
and custom. The world is accustomed to accepting dollars, and
the world still has confidence in the United States. Furthermore,
the central banks of the world are accustomed to accepting US
dollars as the world's reserve currency -- although confidence
in the United States is fraying a bit. My old friend, Doug Casey
calls the dollar "the unbacked liability of a bankrupt nation."
How can he say that?
Lets examine
what's going on. The US is now the world's largest debtor. This
nation is swimming in debt. The buying of US consumers comprises
70 percent of the Gross Domestic Product of the US, and the US
consumer is now spending more than he's earning. The savings
rate of the US consumer has now gone negative -- minus 0.60 percent.
But how about
the government? Consider the national debt of the US, which is
now pushing $8 trillion. The following are increases in
the national debt that have been mandated by Congress. In 2002
the increase in the national debt was $450 billion. In 2003 the
increase rose to $984 billion. In 2004 the increase was $800
billion. This year, in 2005, the House passed an increase of
another $781 billion, although the Senate has not yet acted on
this. In other words, in the last four years the increases have
totaled $3 trillion, which amounts to an increase of 50 percent
in the total national debt.
But the increases
go on. The wars in Iraq and Afghanistan are costing roughly $5
billion a month. Now we have the New Orleans disaster. So far,
President Bush has asked Congress for $10 billion and then another
$52 billion, and the bills just keep coming in. Some estimates
are that hurricane Katrina will cost $120 billion or more before
it's all over, and this is probably conservative.
All the above,
then, constitute the background for the dollar. Can the steady
build up in debt inspire confidence in the dollar? I don't see
how it can. My guess is that an increasing number of countries
are going to "get around" receiving dollars by asking
for payment in the form of a basket of currencies. This means
that these nations are moving to disconnect themselves from the
dollar. The dollar alone will not suffice for payment.
Even a hard-nosed,
sophisticated investor like Warren Buffet has moved to diversify
out of dollars. To do that Buffet has made a $22 billion bet
that the dollar is fated to decline big time. Buffet wants to
offset any dollar losses with profits in his non-dollar position.
What I've written
above represents the big unspoken background for investing. It's
really a sad story. It's sad when you have to worry about your
own country's currency. It's hard enough to pick stocks or investments
that you think are going to work, but when your nation's currency
itself is under suspicion, then nothing is safe, nothing is easy,
nothing is a sure thing long-term "investment."
Ah, but why
worry, why try to use a "monetary crystal ball." Heck,
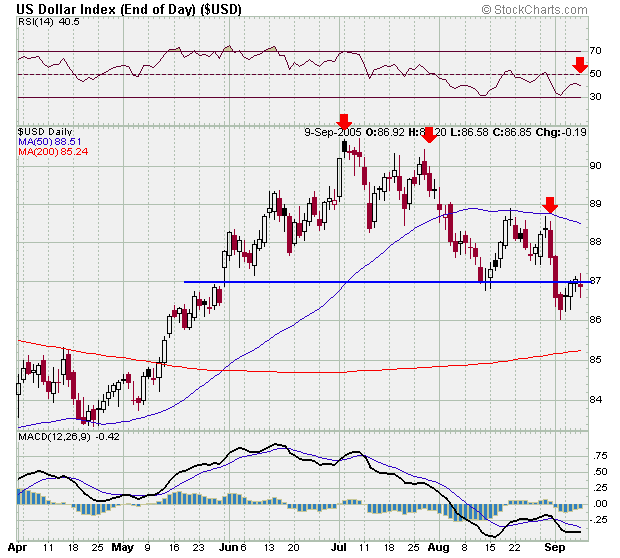
we've got the charts. So saying, let's take a look at the Dollar
Index. Below we see a daily chart, and you have to remember,
this is a chart of the US dollar in terms of a basket of currencies.
The chart shows the Dollar Index looking as though it has topped
out, but now pulling back or even slightly above its "support,"
which is the horizontal blue line.
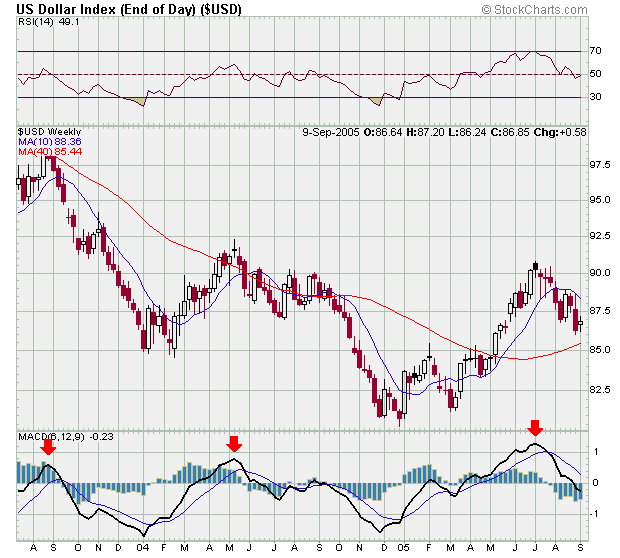
The weekly
chart of the Dollar Index below gives us a better and more important
perspective. Here we see a series of three tops, each top below
the preceding top. At the bottom of the chart MACD has been helpful
in calling the turns, and the latest down-arrow appears to be
calling for a further decline to a potential oversold low --
we're not there yet.
But the Dollar
Index compares the dollar to other fiat currencies. In other
words, it's comparing paper with paper. What about comparing
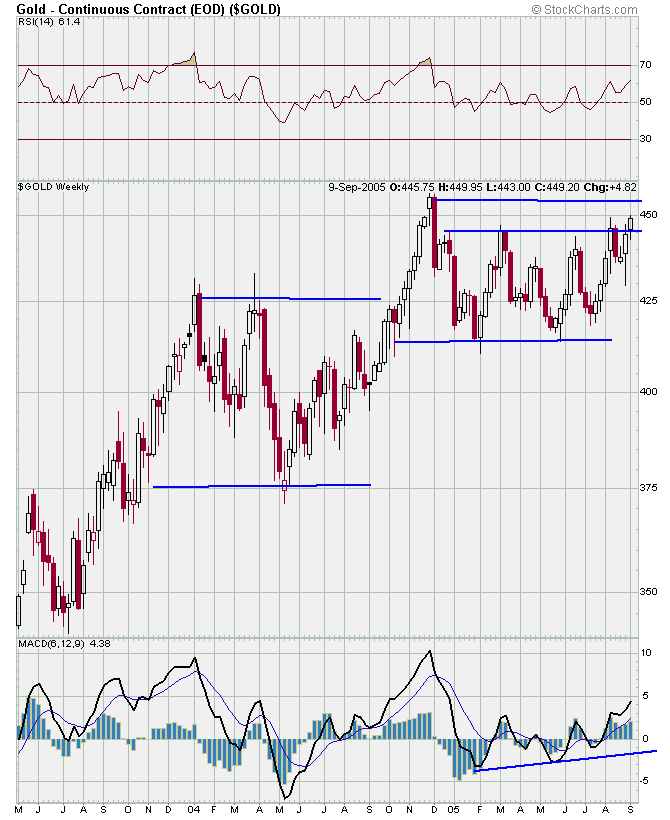
the dollar will real money -- gold? That's what the chart below
does. Here we see gold in terms of dollars.
The "battle
of gold" has been long and arduous. The central banks want
to control the world's money, and gold (real money) is in their
way. Therefore, the central banks have fought gold both economically
and psychologically. They've fought gold economically by periodically
selling portions of their gold holdings. They've fought gold
psychologically by implying that fiat money is real money and
gold is "an ancient relic." This "war against
gold" worked for many years, but it stopped working around
2001-2002. It stopped working when smart money started accumulating
gold when the metal got down to absurd prices around 250 dollars
to the ounce.
Since then
gold has laboriously climbed, layer by layer, level by level.
Which is what we see on the daily chart below. I have delineated
the two most recent layers with horizontal blue lines. The latest
layer is bounded by 420 (dollars) on the bottom and 458 at the
top. There is an inner layer of 450 which gold will have to clear.
As I write, gold has climbed to the vicinity of 450, and now
it's a question of whether spot gold can climb above 450 and
stay there. If so, gold will probably try for the top of the
layer which is at 458.
So as you can
see, gold's climb, so far, has been difficult -- it's been a
battle against the gold banks and the central banks, it's been
an advance inch by inch, foot by foot, yard by yard. This is
because gold is now in the second phase of its bull market. This
is the phase where the public slowly enters the market, it's
the phase where the big money is still moving into the market.
The second phase is the longest phase of a bull market, and it's
usually marked by many corrections against the main bull trend.
more follows for subscribers...
Richard Russell
website: Dow
Theory Letters
email: Dow Theory Letters
Russell Archives
© Copyright 1958-2014 Dow Theory Letters, Inc.
Richard Russell
began publishing Dow Theory Letters in 1958, and he has
been writing the Letters ever since (never once having skipped
a Letter). Dow Theory Letters is the oldest service continuously
written by one person in the business.
He
offers a TRIAL (two consecutive up-to-date issues) for $1.00 (same price that was
originally charged in 1958). Trials, please one time only. Mail
your $1.00 check to: Dow Theory Letters, PO Box 1759, La Jolla,
CA 92038 (annual cost of a subscription is $300, tax deductible
if ordered through your business).
321gold Inc

|
