|
|||
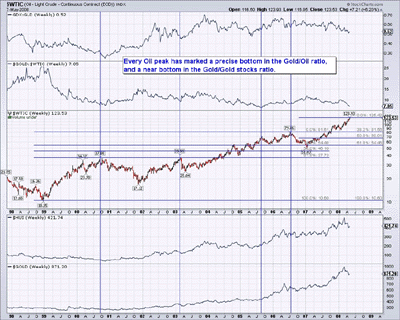
Why a Top in Oil is bullish for Gold StocksJordan Roy-Byrne Technical analysis isn't just a study of price action of a single stock or market. It involves much more. It has been a while since I've written about intermarket analysis, which studies and compares the relationships between markets. Some markets will be weak if certain markets are in a bull trend. Some markets trend together. A simple example of intermarket analysis is that gold and oil (and most commodities) tend to rise together. Wouldn't that entail gold stocks rising as well? Wouldn't that mean rising oil is good for gold stocks? My title is counterintuitive isn't it? Gold and Oil generally follow each other. Up or down. While this is the case it doesn't explain the poor performance in the gold stocks relative to gold. Fundamentally speaking, rising energy costs negatively impact the gold miners. We have to remember that mining is both an energy and capital-intensive business. Inflation hurts the miners too. Anyway, let me explain the following chart in which I have plotted five different markets/relationships. On top is the GDX/GLD ratio (gold stocks/gold), followed by the Gold/Oil ratio and then the price of Oil. On the bottom we have the HUI (gold stock index) and Gold.  I have drawn vertical lines to show the previous important tops in Oil. Each top in oil has corresponded nearly perfectly to a bottom in the Gold/Oil ratio and these bottoms have occurred fairly close to bottoms in the Gdx/Gld ratio. The same can be said for Gold and Gold stocks (HUI) individually. The last top in oil in July 2006 didn't have the same strength of effect as the other three tops. The reason is that top didn't occur at an absolute low in the Gold/Oil ratio, which made a lower bottom six months earlier. That could explain why, when Gold and Gold Stocks began to a rally a few months later, the Gdx/Gld ratio didn't perform well. Why did Gold outperform the gold stocks on the recent move from $800 to $1033? Both the Gold/Oil and Gdx/Gld ratios fell as Oil moved from $85 to $124. Another important point is that these signals are not exact time wise. For the first two peaks in Oil, the HUI bottomed about a month later. The HUI bottom about three months before the next peak in Oil (2005). The October 2006 bottom in the HUI and Gold came about three months after Oil topped. The conclusion though couldn't be clearer. The last four tops in Oil occurred almost simultaneously with bottoms in the Gold/Oil ratio, which correlates strongly to the performance of gold stocks against Gold. Oil is coming up against very strong Fibonacci resistance at $124 to $125 as both the Gdx/Gld and Gold/Oil ratios are at 52-week lows. All the evidence considered, there is very strong evidence that investors are staring in the face the best buying opportunity for gold shares since May 2005 and late 2000. While I have been eagerly anticipating this point since summer 2006, I pointed out in my 2008 Market Outlook that Oil was the single last market for Gold to "best" on a relative basis. Look for the bottom (on Gold/Oil) that was put in yesterday (May 7) to hold, and look for the mining shares to lead the metals to new highs. May 8, 2008 |
