|
|||
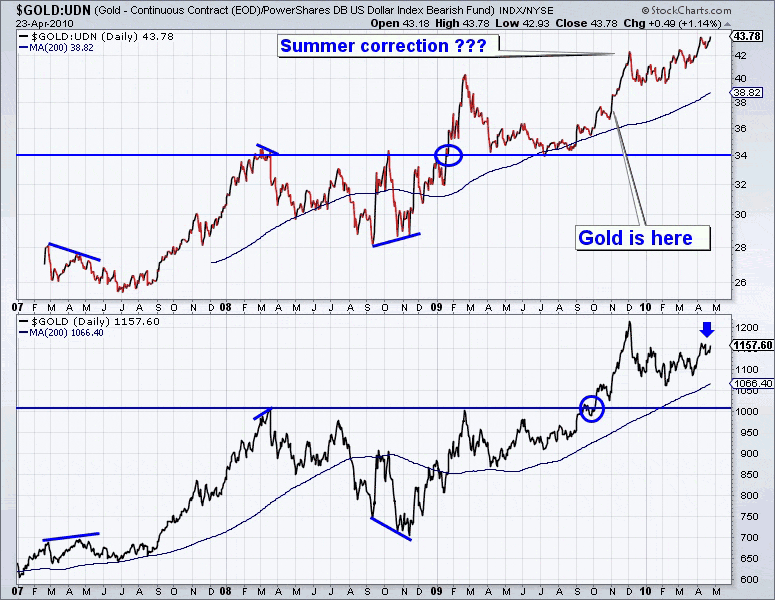
All Aboard the Gold Train as Recognition Move ApproachesJordan Roy-Byrne, CMT Since early 2009 we’ve written about the super-bullish long-term cup and handle pattern in gold. It dates back to 1980 and has a logarithmic target of about $2,100. We noted that previous cup and handle patterns in gold all reached their logarithmic target [1]. We expect that this move to $2,100 will be the recognition move that awakens the masses to the gold bull market and the reality of severe inflation in the near future. Speaking of the near future, the relative strength of gold in the face of a strong US dollar (or weak Euro) is one big hint that this recognition move is around the corner. We’ve noted this before and it is important to explain to new readers. Gold priced in foreign currencies has been leading gold in US$ terms. It is true for the entire bull market and is quite evident in just the past few years. In the chart below we use the foreign currency ETF (UDN) to show gold against currencies ex the US Dollar. The lower half shows gold in US Dollars. Note how Gold/UDN is breaking away to new highs. That chart is so strong that it barely had time for even a small correction. Since Gold/UDN has been leading gold reliably, this is an indication of what is eventually coming in the US Dollar price of gold. (Click on images to enlarge)
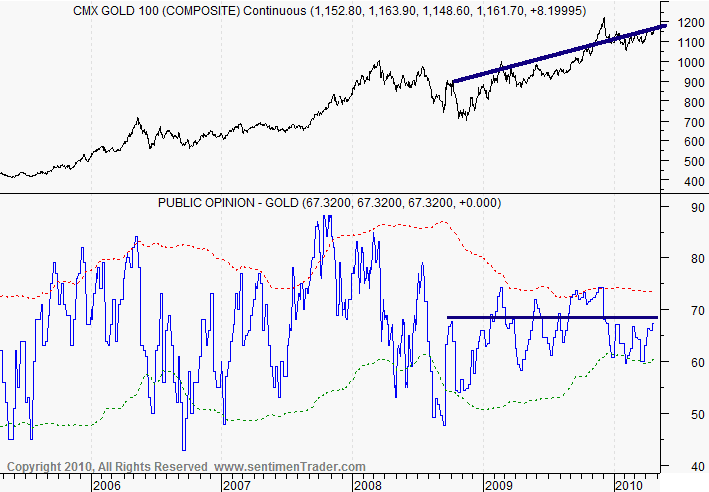
Nowhere Close to a Bubble As gold pierces $1200 and makes a new high, surely we will hear a new round of calls that gold is in a bubble or it is a crowded trade. Be sure to avoid this unsubstantiated nonsense, as it will only serve to waste your time and inevitably reduce your net worth. Let me provide you with just a few pieces of information, which refute this baseless claim. First, did you know that as of a few months ago, gold equities and ETFs only accounted for 0.7% of all managed assets in the world [2]! Can you imagine how high precious metals could rise, if everyone in the world just put 2% of their assets in this sector? What if it was 5% or 10%? Second, Jim Rogers recently spoke at a conference with, in his words, 300 big-time money managers. Apparently 76% of them had never owned gold! Third, superstar fund manager John Paulson of subprime fame has had great difficulty raising money for his gold fund [3]. Even one of the top fund managers can’t even convince people to get aboard the gold train. Finally, consider public opinion on gold, courtesy of sentimentrader.com. In the past, public opinion followed gold higher. Yet, since the end of 2008, public opinion has stayed in a range, while gold has climbed about $300/oz. The public hasn’t budged despite the historic breakout and holding of $1000/oz level.
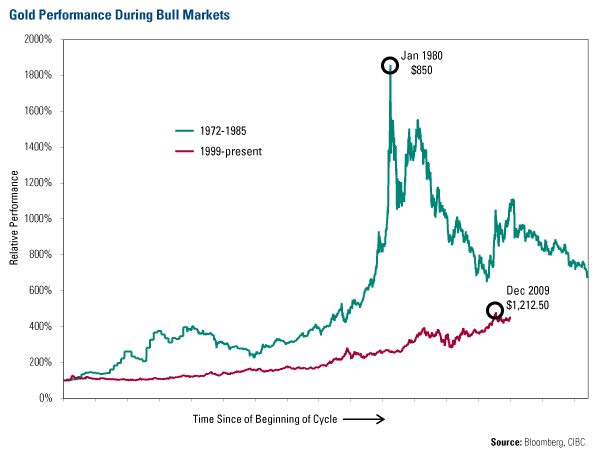
Policy Makers are Shooting Blanks Mainstream and amateur analysts will make the claims that the Fed will tighten or that the government will get serious about its troubling finances. There is almost nothing the authorities can do to stop the coming inflation and the roaring bull market in gold and silver. First and most importantly, because of the overall debt level, which is massive compared to 1980, the US cannot afford to let interest rates rise. If interest rates rise, the market will only lose greater and greater confidence in the US as the interest burden will accelerate thereby hurting the economy’s ability to grow and hastening the threat of bankruptcy. However, if interest rates remain low, speculation in hard assets will become rampant as these markets continue to rise, inflation ticks up and purchasing power declines. Second, the Fed would have difficulty trying to tighten the money supply. Remember that to do this, the Fed would need to sell assets into the market. Remember, the Fed’s balance sheet consists of garbage assets that the Fed overpaid for. Yes they could raise interest rates but then how would the banks survive? They wouldn’t be able to borrow at 0.25% and repair their balance sheets. If the Fed would raise rates above the level of inflation, it would certainly end up threatening the financial system. Moreover, as we’ve noted again and again, severe inflation results from a loss of confidence in a government’s ability to meet its debts. This manifests in a falling bond market, rising interest rates and currency weakness. Debt crises go hand in hand with currency crises. Hence, we see gold breaking out against numerous currencies even though “the banks aren’t lending” and “velocity is falling.” The last line of defense is the Treasury market. If and when interest rates breakout to the upside, the authorities will effectively lose both control and power. At that point, the inflation genie will be out of the bottle. The action in gold is already hinting at that outcome. Conclusion Even though gold has risen nine years in a row, it is nowhere near a bubble. Just take a look at this chart courtesy of Frank Holmes and Bloomberg. It compares gold’s current bull market with its bull market in the 1970s.
Note that gold rose about six-fold the first eight years into the bull market (it began in 1970). Ultimately it rose 25-fold. The Nasdaq from 1982 to 1992 advanced about four fold. Ultimately it rose 29-fold. The Nikkei advanced less than three fold from 1970 to 1978. From 1970 to 1990 it gained 19-fold. Gold is nine years into its bull market and has advanced less than five fold. See a pattern here? If you’d like professional assistance riding the coming acceleration and eventual mania in the Gold and Silver market, then visit our website and consider a free 14-day trial to our premium newsletter. Footnotes: 1) http://www.321gold.com/editorials/roy_byrne/roy_byrne021209.html 2) http://thedailygold.com/chartstechnicals/gold-is-0-7-of-global-managed-assets/?p=887/ 3) http://online.wsj.com/article/SB1000142405274870361590457505379 ### Jordan Roy-Byrne, CMT 321gold Ltd |