Gold: A look at the charts
Ron Rosen
December 14, 2004
It is clear the precious metal
shares are correcting and it will be a difficult correction as
I see it. The selloff may not be as bad as the one that took
place in 1974. We do appear to be having a 30-year cycle
repeat performance in many areas. Wave theory can be a mish mosh
of nothing but hopes and fears if you keep your nose stuck to
the canvas. If you back off and take a look from a distance you
may discover some helpful information. Here is what I
see.
 The current
monthly chart of the HUI shows a flat type correction unfolding.
The peak was December of 2003. The down move that followed and
bottomed in the month of May 2004 I labeled Wave A. This was
followed by a rally that just peaked in November. This I labeled
Wave B. Wave B failed to make a new high and price has started
down in Wave C. Wave C should be the final Wave down and take
us to the area of the previous Wave 4. The full range for the
previous Wave 4 is 90 to 150. I think it is reasonable to assume
that the decline may halt at or near the apex of the triangle
that wave 4 formed. Fourth waves often take the shape of a triangle.
The apex is aproximatly at 120. If we decline to the 120 area
the correction may be over. The current
monthly chart of the HUI shows a flat type correction unfolding.
The peak was December of 2003. The down move that followed and
bottomed in the month of May 2004 I labeled Wave A. This was
followed by a rally that just peaked in November. This I labeled
Wave B. Wave B failed to make a new high and price has started
down in Wave C. Wave C should be the final Wave down and take
us to the area of the previous Wave 4. The full range for the
previous Wave 4 is 90 to 150. I think it is reasonable to assume
that the decline may halt at or near the apex of the triangle
that wave 4 formed. Fourth waves often take the shape of a triangle.
The apex is aproximatly at 120. If we decline to the 120 area
the correction may be over.
In 1974 Homestake was the bellweather
stock for gold shares. It had a very severe correction that wiped
out more than 60 percent of its market value. On August 16, 1974
Homestake topped at a price of $11.31 a share. It bottomed in
the $4.40 area. That represented a collapse of about 62 percent.
I do not believe that the HUI will have a correction as vicious
as Homestake did in 1974/1975. My reason for thinking the selloff
this time, 30 years later, will not be as bad is the "rule"
of alternation. The correction in 1974 was an A, B, C zig zag.
The correction in the HUI this time around has the appearance
of a potential FLAT and not a ZIG ZAG. Corrections tend to alternate
in type and appearance. They alternate even three decades apart
in the same items. If this analysis is correct, sometime in 2005
we may have a bottom in the HUI but not a smash. If this correction
continues as a FLAT it is sending a very bullish message for
the HUI. A FLAT type correction means there is very strong underlying
support . This support drove the price right back up to near
its high. This indicates that a collapse will most likely
be avoided. A collapse like the one Homestake experienced in
the last 30 year cycle.
However the price of the HUI is headed down and it won't
be fun to watch if you are holding the shares. The bottom, if
it is typical of a flat, will most likely go below the low of
WAVE A. That was in the 160 area for the HUI. The monthly chart
shows six months down then six months up. We now are facing a
potential six months down to end the entire correction. We should
have a bottom sometime this Summer. After the bottom I expect
a period of reaccumulation to take place. This should take the
form of a gradual rise with periodic shakeouts. This process
should lead to an"orgiastic" type rise and explosion
late in this decade. On the monthly chart you can see the five
waves up starting in 2000, and wave A and B of the Flat type
correction.
Notice the monthly technicals
under the chart. They are not bullish.
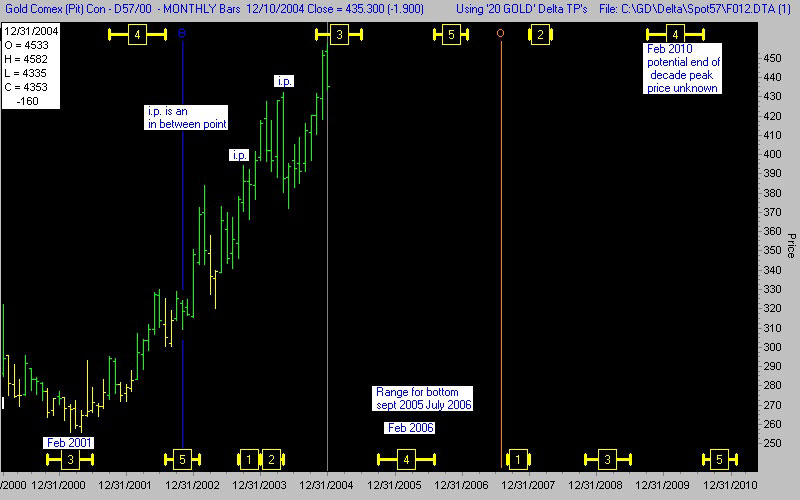
Gold bullion may have a correction
that lasts about 18 months as well. The problem with Gold bullion
is that its correction just started. Once the HUI bottoms
in Summer 2005 it should outperform gold bullion for about twelve
months. Clearly if Gold bullion is still going down - but the
HUI is leveling off and rising - the HUI will outperform bullion.
Gold bullion is due for a bottom between Feb and July 2006. If
you start trading Gold bullion from the long side when the HUI
bottoms you may be subject to a frustating and unprofitable experience.
My thought is to start trading the Gold shares from the long
side first and wait to go long gold bullion. Wait until sometime
in 2006. These time factors for bottoms for the HUI and gold
bullion would be similar to the 30 year cycle. So far, many commodities
are following this cycle.
To be continued...
Ron
Rosen
email: rrosen5@tampabay.rr.com
The Tee chart is reproduced
courtesy of The Delta Society International.
321gold Inc

|