 Precious Metals
Market Timing Precious Metals
Market Timing
Looking for Clues
Ron Rosen
Nov 28, 2005
"We seek him
here, we seek him there
Those Frenchies seek him everywhere.
Is he in Heaven? Is he in Hell?
That dammed elusive Pimpernel!"
I do believe the Scarlet Pimpernel
was living in an earlier century than was Sherlock Holmes. Holmes
would truly have a difficult time finding any clues that led
him to, "That dammed elusive Pimpernel."
There are clues and then there
are clues. Gold bullion has been making new highs. I hereby present
some clues that I believe may be of some value in discovering
why the HUI and most precious metal shares refuse to make new
highs. There may be a message in these clues. I doubt we will
have to wait very long to find out if they are of any value.
The purpose of this report
is to show that regardless of the breakout of gold bullion there
is still the probability of a severe correction in the HUI and
other precious metal shares. There is enough contrary evidence
for me to hesitate about announcing, "All aboard. The train
is leaving the station." I have read a number of reports
that state the bull market in the precious metals and their shares
has resumed. I don't think it is presumptuous of us to require
gold and silver bullion and their shares to make new highs before
we can be confident that the bull market has resumed. Waiting
for all of the evidence to arrive will also give our trading
program a much better chance of starting with profits rather
than losses.
The reason for waiting is really
simple. I have seen a number of bull markets over the past 50
years. Every single one of them went much higher than most analysts
predicted. There is very little we will miss by waiting for the
evidence to arrive. If we do have a sharp drop in the price of
the HUI, there will be much to gain. The HUI is currently in
the 245 range. A drop down to the 150 area would represent about
a 40 % decline. If we began accumulating shares as the HUI approached
the 150 area, we will have avoided a great deal of pain. When
the bull market is confirmed by the HUI closing over 258, we
would already have about a 70 % gain. $100,000 invested near
a potential HUI bottom of 150 would be worth about $170,000 at
the break out point of 258. A double from that point forward
would mean that our $100,000 would be worth well over $300,000.
If you do the math, it gets better as the rise continues. Is
this a rambling fantasy of an old man? Maybe, maybe not. This
mature elder, person (sounds better than old man) believes there
is sufficient evidence to cause us to wait before we leap in.
Allow me to share the evidence with you.
From time to time in this report
I will be quoting W.D.Gann. He was one of the great stock and
commodity market teachers.
"The farther back you
have a record of a stock or commodity and the more you study
it, the more you will understand its actions and know when it
is making tops and bottoms." -W.D. Gann
I will be presenting evidence
from gold, silver the HUI and XAU indexes.
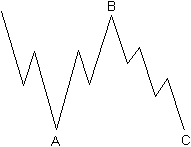
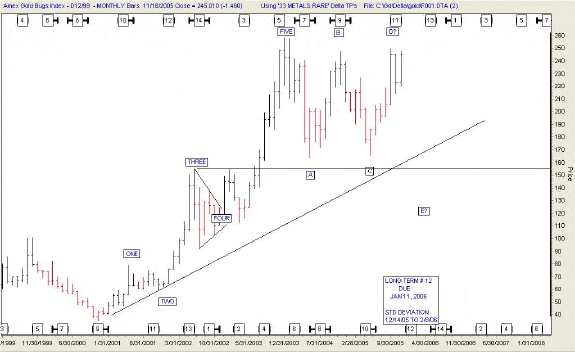
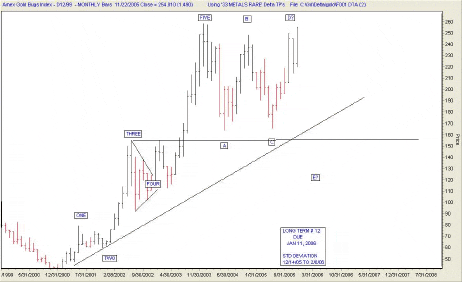
I originally thought the HUI
was making a flat type correction as per the illustration over
the chart. A perfect flat correction would be 3 waves down in
leg a, three waves up in leg b, and a final 5 waves down in leg
c. When it became obvious that leg c was not going to be 5 waves
down, I knew something else was brewing. The illustration of,
"something else" is on the page below this chart.
 HUI MONTHLY CHART
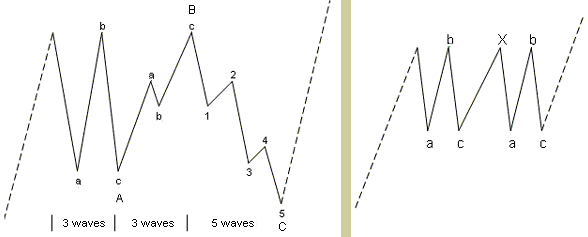
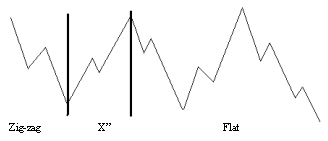
We may be witnessing one of
these two types of corrections. I don't know which one at this
point. If you look carefully at the first illustration and compare
it to the chart of the HUI, we are due for one more wave down.
That would be wave c and have 5 small waves of its own. This
would complete this long drawn out correction and finally lead
to the next bull phase for the HUI.
If the price of the HUI drops
to the previous lows the major rising trend line should be broken
to the down side. This may accompany the final wash out to corrective
lows.
 HUI MONTHLY
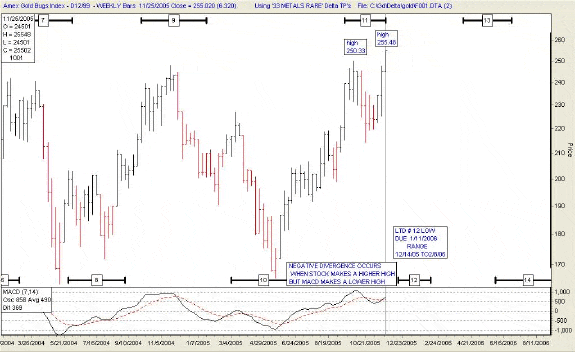
"NEGATIVE DIVERGENCES
ARE PROBABLY THE LEAST COMMON OF THE THREE SIGNALS, BUT ARE USUALLY
THE MOST RELIABLE AND CAN WARN OF AN IMPENDING PEAK." ...
Stockcharts.com
Negative Divergence
"A negative divergence
forms when the security advances or moves sideways and MACD declines.
The negative divergence in MACD can take the form of either a
lower high or a straight decline. Negative divergences are probably
the least common of the three signals, but are usually the most
reliable and can warn of an impending peak."
HUI WEEKLY
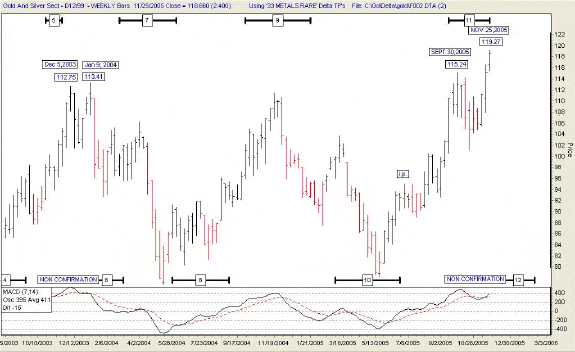
"NEGATIVE DIVERGENCES
ARE PROBABLY THE LEAST COMMON OF THE THREE SIGNALS, BUT ARE USUALLY
THE MOST RELIABLE AND CAN WARN OF AN IMPENDING PEAK." ...
-stockcharts.com
XAU WEEKLY
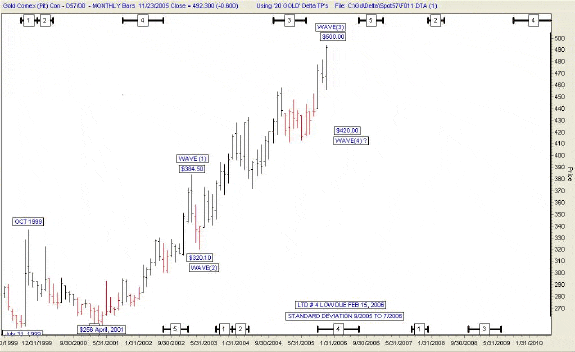
The statement below is by Alf
Field. He is one of the few people that have been using Elliott
wave counts longer than I have. He is excellent at what he does
and has made minor adjustments as the market proceeds.
I have posted his wave count below
and next to the monthly gold chart. From the $382 high he expected
a corrective low at $320. You can see that low on the
chart. He projected the next wave to top at $500. We are just
about there. From $500 he expects a correction down to $420.
From $420 he projects a wave up to $630 and that would complete
only the first major wave up. He designates the first major wave
as Wave (1). After reaching $630 in major Wave (1)* there is
still major wave (2) down,(3) up, (4) down and finally Wave (5)
up. This would complete the entire gold bull market. His numbers
are based on the London Gold second fix which is slightly different
then our futures chart. The final Major Wave (5) is usually the
Wild and Wooly Wave where the "Mad Hatters" come out
to play. It should be a sight to behold!
(Wave I is up, II is
down, III is up, IV is down, V is up)

"I have some minor credentials
for entering this debate. I was using the Elliott Wave Principle
(EWP) years before Bob Prechter popularized it with his books
on the subject and his accurate calls in his monthly publication
"The Elliott Wave Theorist". During the 1970's I had
a degree of success using the EWP in the gold market. For some
reason, possibly the huge emotional element in this market, I
found that the EWP produced its best results in the gold market.
I am not a gung ho advocate
of the EWP. I discovered not only its strengths but also its
weaknesses. I prefer to have fundamentals, technicals and the
EWP all in place (if possible) before committing myself to an
investment. The EWP does have the tools to provide a magnificent
guide to potential future market movements and turning points,
these being its major strengths." -Alf Field
GOLD MONTHLY CHART
We may be very close to the
final wash out of the precious metal shares. The evidence for
a final wash out is very powerful.
1. "NEGATIVE DIVERGENCES
ARE PROBABLY THE LEAST COMMON OF THE THREE SIGNALS, BUT ARE USUALLY
THE MOST RELIABLE AND CAN WARN OF AN IMPENDING PEAK." ...
stockcharts.com
"...the most reliable
and can warn of an impending peak..."
2. A corrective wave formation
on the HUI, XAU and various precious metal shares that calls
for one more wave down.

3. Alf Field's Wave
count that calls for a drop to $420 after reaching the price
of $500 an ounce. $500 is just about here. After the drop to
$420 a rise to $630 is projected.
I am aware that just about
everything written about gold and the gold shares is extremely
bullish right now. The expectation is that the move has started
and will continue.
The evidence I have presented
says otherwise. A bit more patience and we may have the opportunity
to acquire lower priced shares. If not, we know this gold bull
market has a long way to go before it reaches a top. I will recommend
that we enter when the market has finally tipped its hand.
Silver bullion appears to have
completed four waves of a potential five wave triangle. It should
soon be headed for Delta long term # 4 low, due in mid February
2006, and medium term # 8 or # 10. If it is to start down soon,
that would require an early medium # 7 high.
2004 to 2006 SILVER
WEEKLY CHART
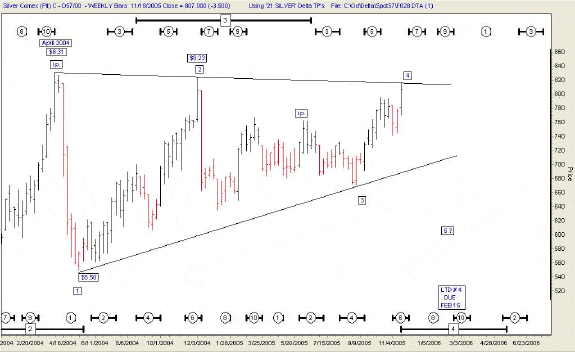
The silver chart patterns 30
years apart are similar. The timing of the major highs and lows
is very similar and quite remarkable. Silver is the commodity
whose timing conforms best to the Gann 30year Master Cycle. The
timing dates of highs and lows, for silver, 30 years apart are
listed on the page below.
1974 to 1976 SILVER
WEEKLY CHART
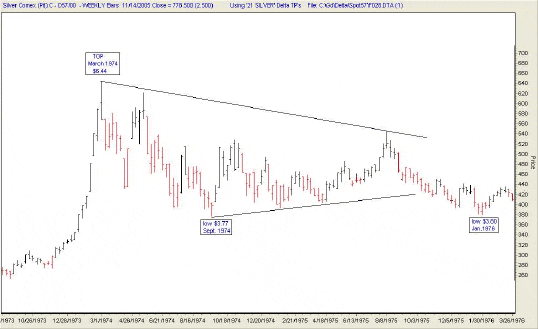
If silver continues to repeat
its patterns of 30 years ago it should bottom in the $5.50 to
$6.00 area. The long term Delta turning point # 4 tells us this
may occur in February 2006.
THE IMPORTANCE OF THE 30
YEAR SILVER CYCLE
Silver bottomed on November
3, 1971.
30 years later
Silver made a double bottom on November 26, 2001.
Starting on November 3, 1971,
silver advanced for 2 years, 3 months and 23 days.
30 years later
Starting on November 26, 2001, silver advanced for 2 years, 4
months and 7 days.
Silver topped on February 26,
1974 and had a vicious decline of 43 %.
30 years later
Silver topped on April 2, 2004 and had a vicious decline of 45
%.
Silver bottomed on January
26, 1976.
30 years later
Silver is due for a Delta long term # 4 low on February 15, 1976.
2004 to 2006 SILVER CHART
1974 to 1976 SILVER CHART
 I will end this bit of technical treasure
hunting with a picture of our friend Sherlock Holmes. He is looking
for clues. I am doing the same thing. There are many areas in
the market that we should look at and try to make sense of in
order to arrive at reasonable conclusions. We must look back
as far as we can to see what happened in the past. W.D.Gann was
wise enough to know that in the markets as with people and Nature,
in due time," The past is Prologue." It is a lot of
work, but I find it fascinating and fun. I will end this bit of technical treasure
hunting with a picture of our friend Sherlock Holmes. He is looking
for clues. I am doing the same thing. There are many areas in
the market that we should look at and try to make sense of in
order to arrive at reasonable conclusions. We must look back
as far as we can to see what happened in the past. W.D.Gann was
wise enough to know that in the markets as with people and Nature,
in due time," The past is Prologue." It is a lot of
work, but I find it fascinating and fun.
We either board the train if
it leaves the station soon or continue to review what I have
presented today. Remember this, bull markets go higher than most
analysts and observers believe is possible. Boarding the train
on a break out to new highs of the HUI, along with other required
evidence, will give us the confidence we need to know the bull
market has resumed.
In my opinion, this is the
safest and best way to proceed. However, if we do experience
a severe decline, I will be suggesting we buy some bargains at
lower prices.
Stay Well,
Ron Rosen
email: rrosen5@tampabay.rr.com
Subscriptions
are available at:
www.wilder-concepts.com/rosenletter.aspx
 Disclaimer: The contents of this
letter represent the opinions of Ronald L. Rosen and Alistair
Gilbert. Nothing contained herein is intended as investment
advice or recommendations for specific investment decisions, and
you should not rely on it as such. Ronald L. Rosen and Alistair
Gilbert are not registered investment advisors. Information and
analysis above are derived from sources and using methods believed
to be reliable, but Ronald L. Rosen and Alistair Gilbert cannot
accept responsibility for any trading losses you may incur as
a result of your reliance on this analysis and will not be held
liable for the consequence of reliance upon any opinion or statement
contained herein or any omission. Individuals should consult with
their broker and personal financial advisors before engaging in
any trading activities. Do your own due diligence regarding personal
investment decisions. Disclaimer: The contents of this
letter represent the opinions of Ronald L. Rosen and Alistair
Gilbert. Nothing contained herein is intended as investment
advice or recommendations for specific investment decisions, and
you should not rely on it as such. Ronald L. Rosen and Alistair
Gilbert are not registered investment advisors. Information and
analysis above are derived from sources and using methods believed
to be reliable, but Ronald L. Rosen and Alistair Gilbert cannot
accept responsibility for any trading losses you may incur as
a result of your reliance on this analysis and will not be held
liable for the consequence of reliance upon any opinion or statement
contained herein or any omission. Individuals should consult with
their broker and personal financial advisors before engaging in
any trading activities. Do your own due diligence regarding personal
investment decisions.
The Delta Story
Tee charts reproduced
courtesy of The Delta Society International.
321gold Inc

|