Precious Metals Market Timing
The Road Less Traveled
Trading the gold E.T.F. using Delta
medium turning points
Ron Rosen
Oct 4, 2005
"Time is more important
than price; when time is up price will reverse." -W.D.
Gann
 Trading
gold on the commodity exchange is a risky business as we all
know. Trading the gold ETF on the New York Stock Exchange using
Delta medium turning points, by comparison, is a quiet stroll
down a beautiful country road. This simple and elegant way of
trading gold is not known by many. It is elegant because of the
use of Delta turning points. Trading
gold on the commodity exchange is a risky business as we all
know. Trading the gold ETF on the New York Stock Exchange using
Delta medium turning points, by comparison, is a quiet stroll
down a beautiful country road. This simple and elegant way of
trading gold is not known by many. It is elegant because of the
use of Delta turning points.
The gold ETF is traded like
a stock and the same margin rules apply. Let's call it a gentle
way to trade gold and avoid the pits. However, armed with the
Delta turning points you will have made yourself into a "Trader
Extraordinaire." You won't have to be worried about a $10
or $20 move in gold stopping you out. A $10 or $20 move in gold
is a $1 or $2 move in the gold ETF. The symbol for the gold ETF
is GLD. The gold ETF does not expire like a commodity contract.
You don't have to worry about rolling over contracts, taking
delivery, and all the other problems that potentially come with
trading a commodity contract. If you are not a commodity pro
and don't want to be, but are interested in trading gold, this
is the way to go. The most difficult part of trading commodities,
for many, is handling the stress. Using Delta and applying it
to the ETF should eliminate much of the stress.
A $10 to $20 move in gold will
produce a $1000 to $2000 profit on one thousand shares of the
ETF.
I will be posting the ETF chart
on a regular basis. In addition, I will be posting the results
of a hypothetical 1000 share gold ETF trading account using Delta
medium turning points.
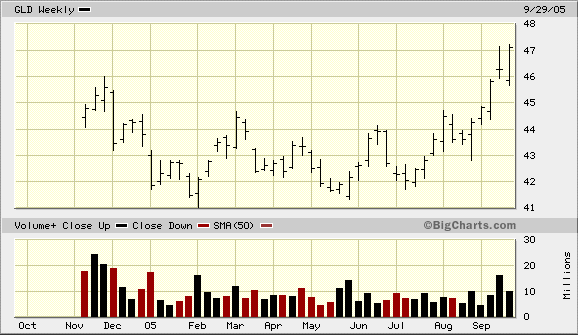
GLD WEEKLY (ETF)
 ***
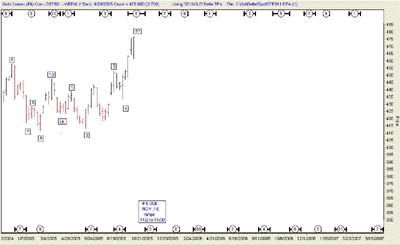
GOLD WEEKLY DELTA
CHART
***
GOLD WEEKLY DELTA
CHART
click image to see
chart
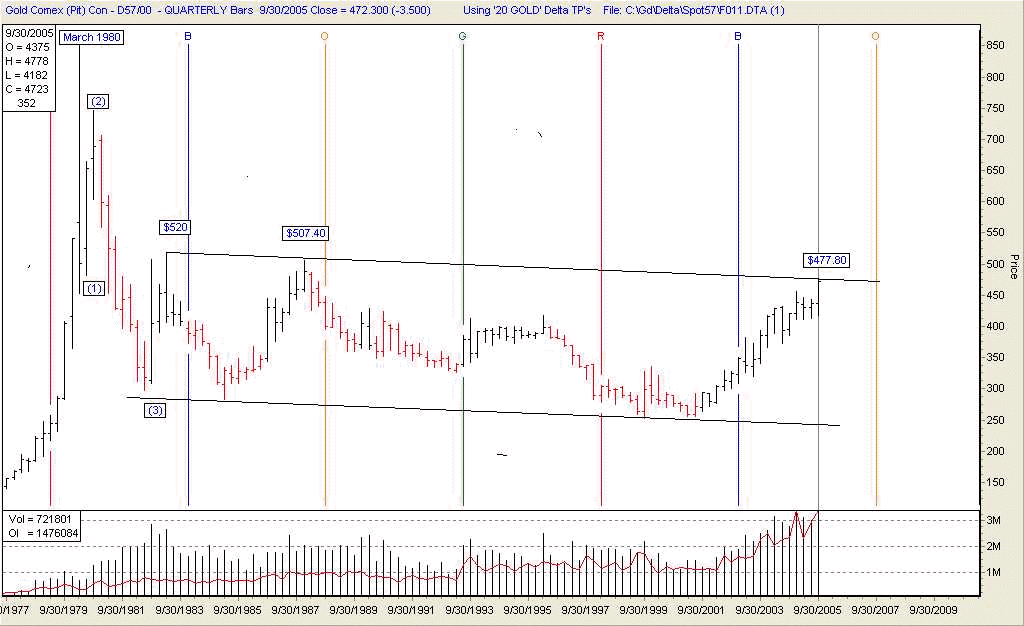
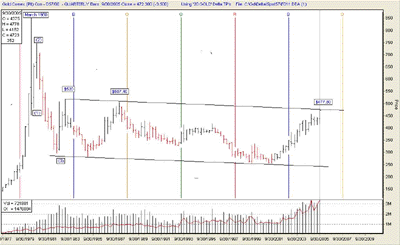
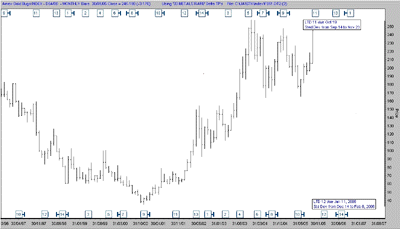
The price of gold is still
contained within the 23 year parallel channel. However, the increased
open interest and volume indicate that a bullish breakout may
occur in the future. The price of gold may back off some in order
to get a running start and hurdle the barricade. The Delta gold
charts posted below show a long term low due in February 2006.
Unless that turning point low arrives early, there should at
the very least be some backing and filling starting soon.
QUARTERLY GOLD CHART
click image to see
chart
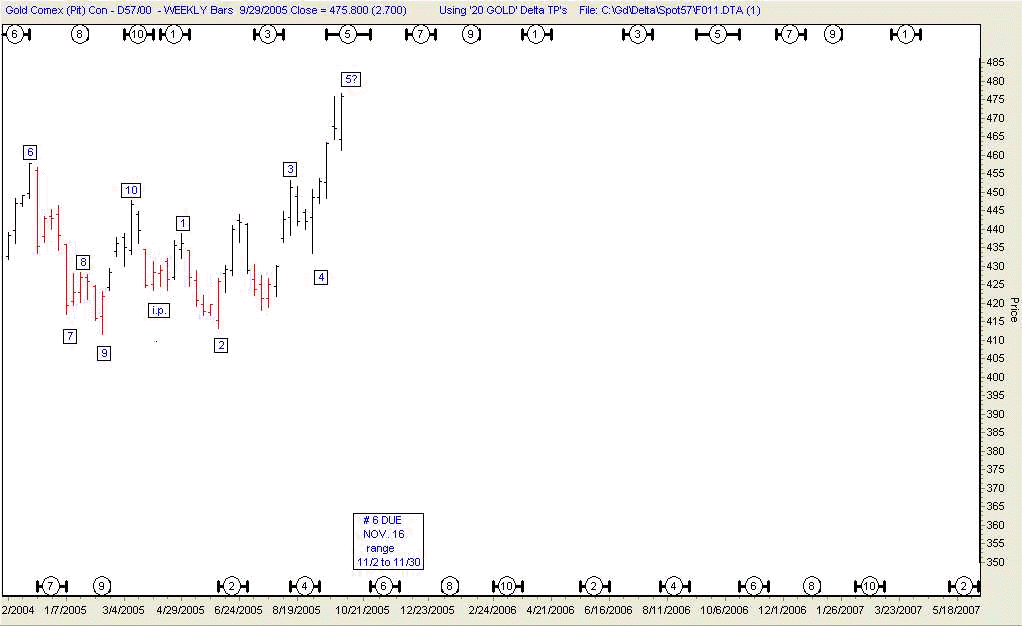
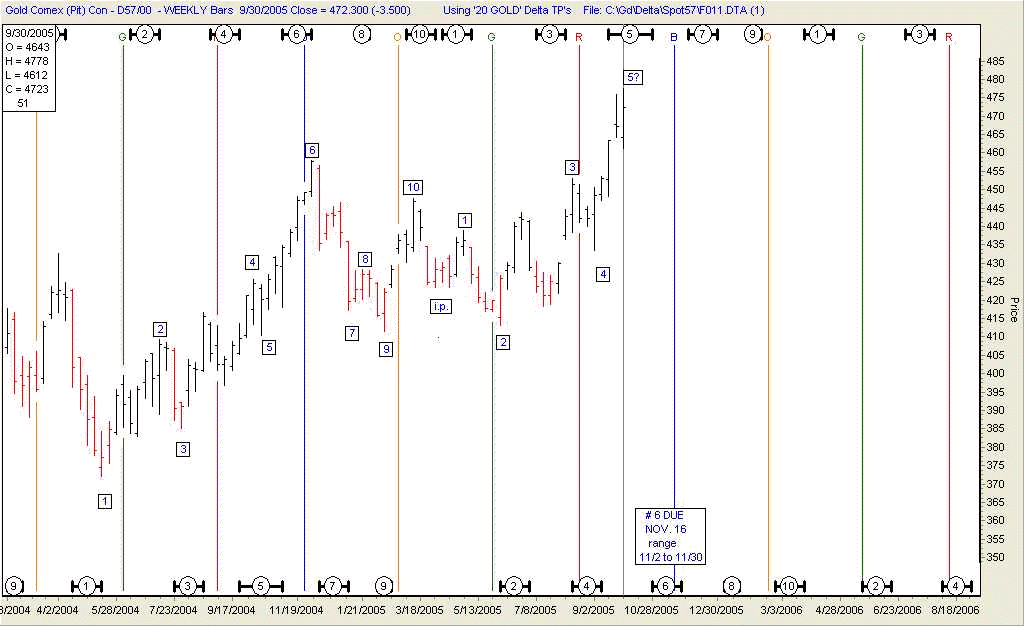
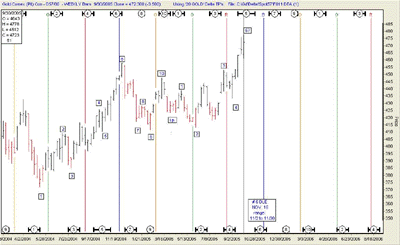
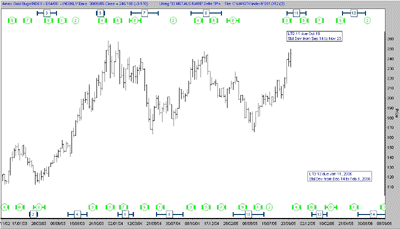
This weekly gold chart shows
that we are in the area of Delta medium #5 high. Once confirmed,
price will be headed for medium # 6 low due on November 16. The
range for arrival is between November 2nd and November 30th.
GOLD WEEKLY CHART
click image to see
chart
GOLD CORRECTIONS
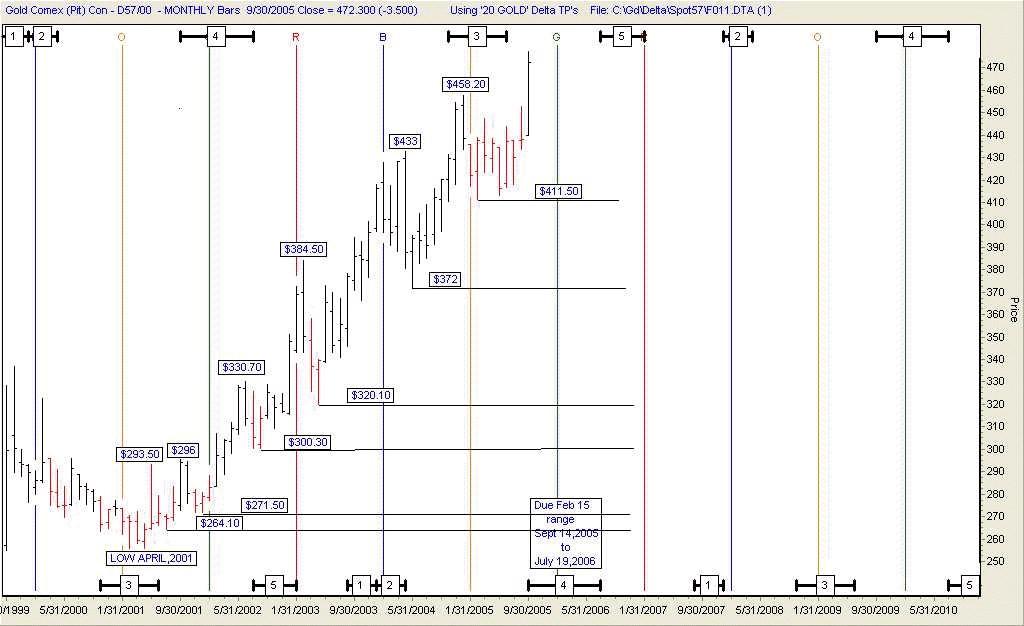
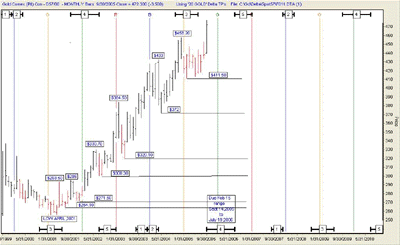
The Monthly Gold Chart
On all but one occasion, when
gold corrected a rise, it went below the previous peak. The one
occasion was when gold peaked at $330.70. It then corrected down
to $300.30, which was only $4.30 above the previous peak. It
appears reasonable to assume that when the gold price reaches
a top for this run, it will go below the previous high. The previous
high was $458.20. Since this gold move started, the monthly chart
shows us that gold has consistently made higher highs and higher
lows. This indicates a mighty powerful, long term move is underway.
Either Delta long term # 3 high arrived late, or # 4 low came
in very early. In very powerful bull moves, Delta highs can arrive
late. More time is spent going up than normal. In a very powerful
bull move, the lows tend to arrive early because the move does
not spend a lot of time going down. However, if Delta # 4 low
is in, this would have been an extremely early arrival. I believe
Delta # 4 long term low has not yet arrived.
GOLD MONTHLY CHART
click image to see chart
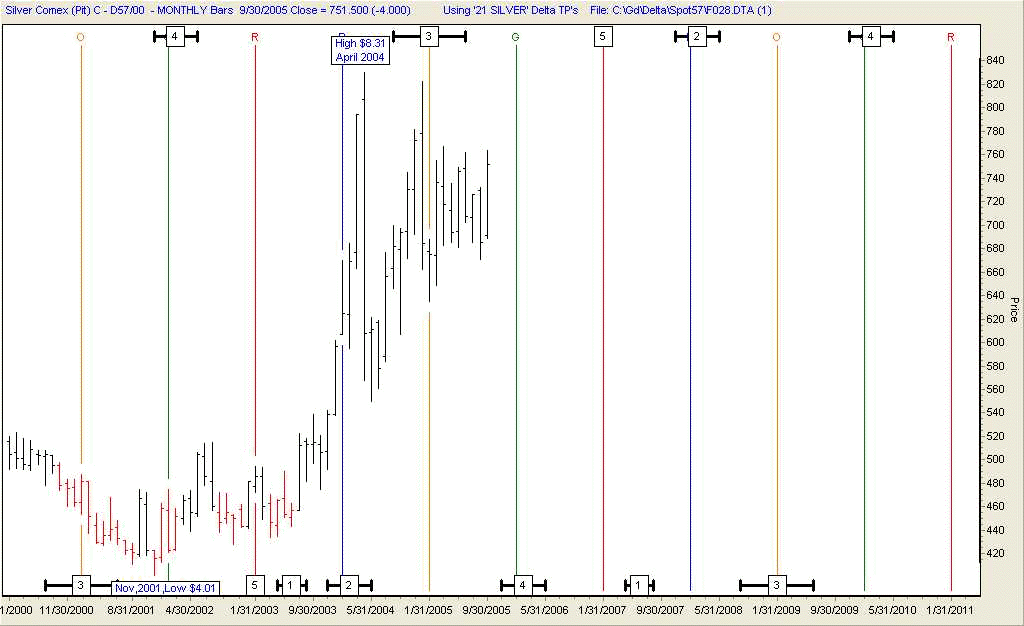
SILVER CORRECTIONS
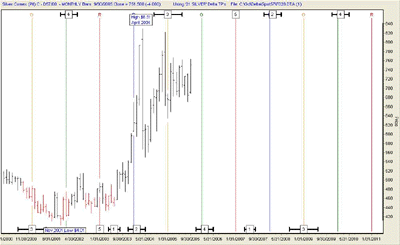
The Monthly Silver Chart
In spite of all the extreme
bullish talk about silver this past number of years, the monthly
chart shows us that silvers performance is sub par compared to
gold's. However, silver is consistently making higher lows on
the monthly chart and that is long term bullish. Silver's percentage
increase in this bull move does not compare to its percentage
move in the 1970s. This time silver slightly more than doubled.
In the 1970s, a comparable time period, silver went from $1.28
to $6.44. That was a 500% move.
Silver had an IN- BETWEEN POINT
and made a Delta long term # 2 low. The # 3 high was made on
time, even though the IN-BETWEENPOINT was higher. We are now
headed for Delta long term # 4 low, due in February 2006 with
a standard deviation out to May 2006.
SILVER MONTHLY CHART
click image to see
chart
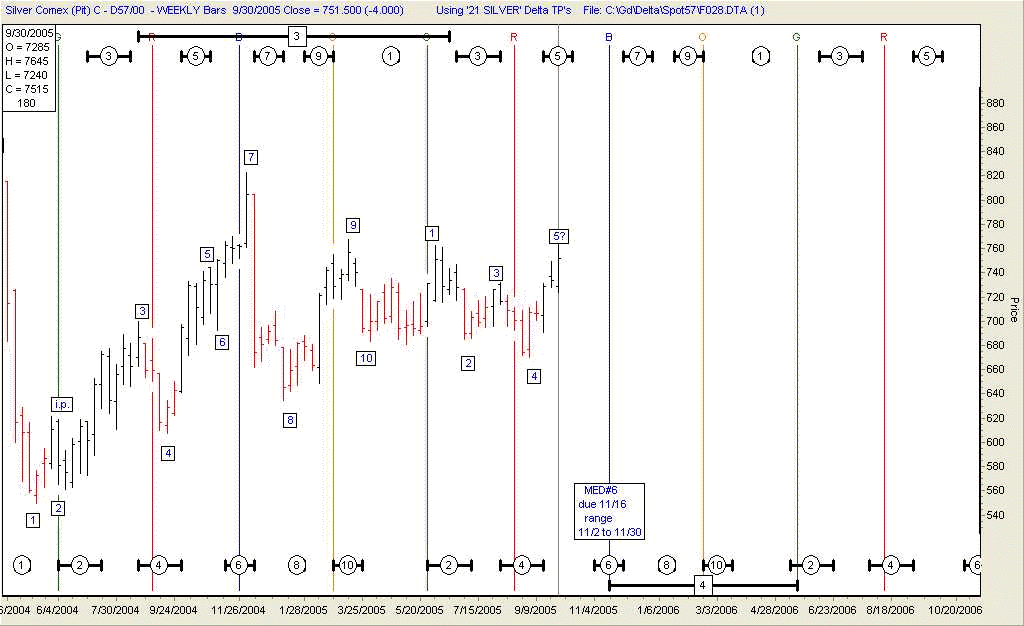
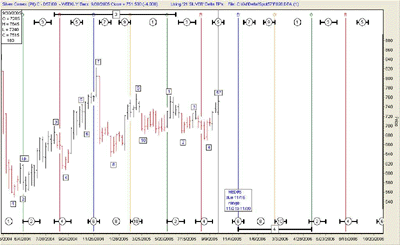
The Super Silver Bugs have
been waiting a long time for silver to outperform Gold, based
on the silver shortage. So far, in this bull market, silver is
lagging gold's performance and has not made a new high as gold
has. If you are a Super Silver bug do not despair. Silver under
performed gold in the last precious metals bull market in the
1970's. Near the end of the Bull Run for the precious metals
silver woke up and put on a spectacular performance. A Delta
medium # 5 high may have been made or will be soon. The next
stop will be Delta medium # 6 low, due on November 16th. The
range for arrival is between November 2nd and November 30th.
The silver shares seem to be lagging behind the gold shares.
That may be an indication that silvers timing may repeat the
timing of the 1970's or continue to under perform gold.
SILVER WEEKLY CHART
click image to see
chart
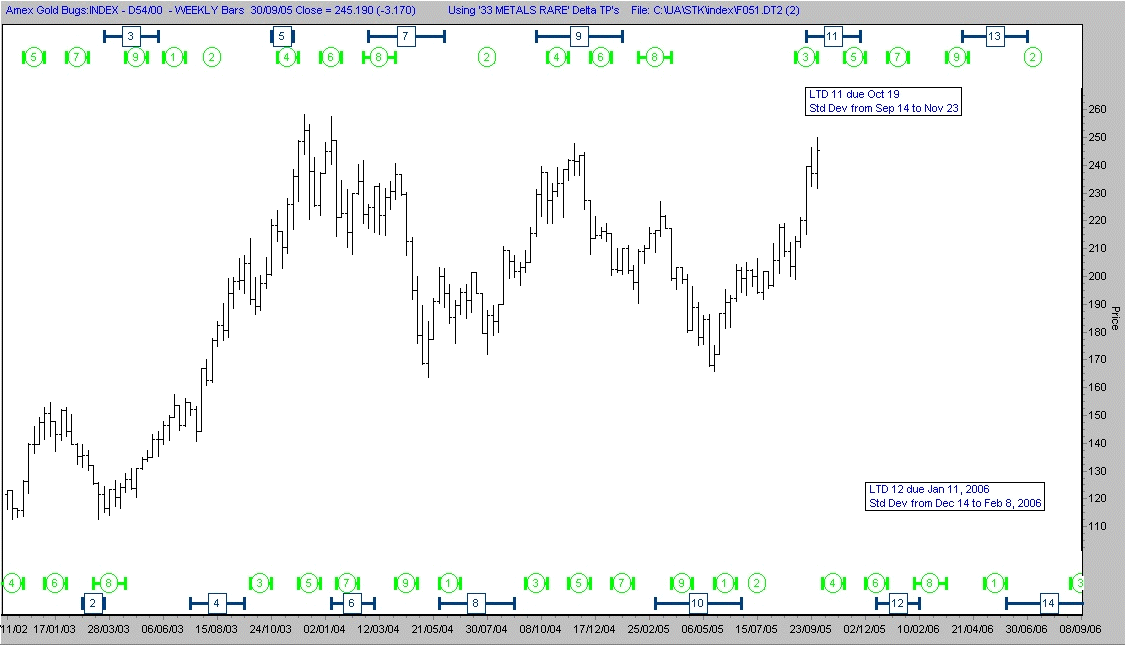
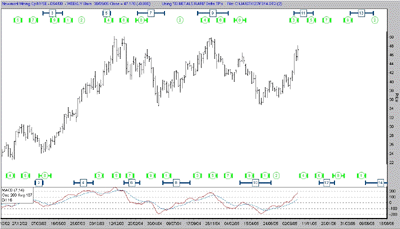
The HUI either has or will
shortly reach a high at Delta medium # 3(green). It also is in
the range of Delta long term # 11 High. Delta long term # 12
is not due until January, 2006.
There are a number of technicians
who believe that the HUI completed a three wave correction and
has started the second or next bull phase with this move up from
the 165 area. I am not so sure for several reasons. The HUI could
still have one more wave down to make this a five wave correction.
Rather then go into a detailed description of the various types
of corrections we could still witness, I prefer to hold judgment
on whether or not the next bull move has started. Let's see what
the Delta highs do to the price. If you look back at the Delta
long term highs and lows on this chart, you will see that they
have been an excellent guide as to the coming highs and lows.
HUI WEEKLY CHART
click image to see
chart
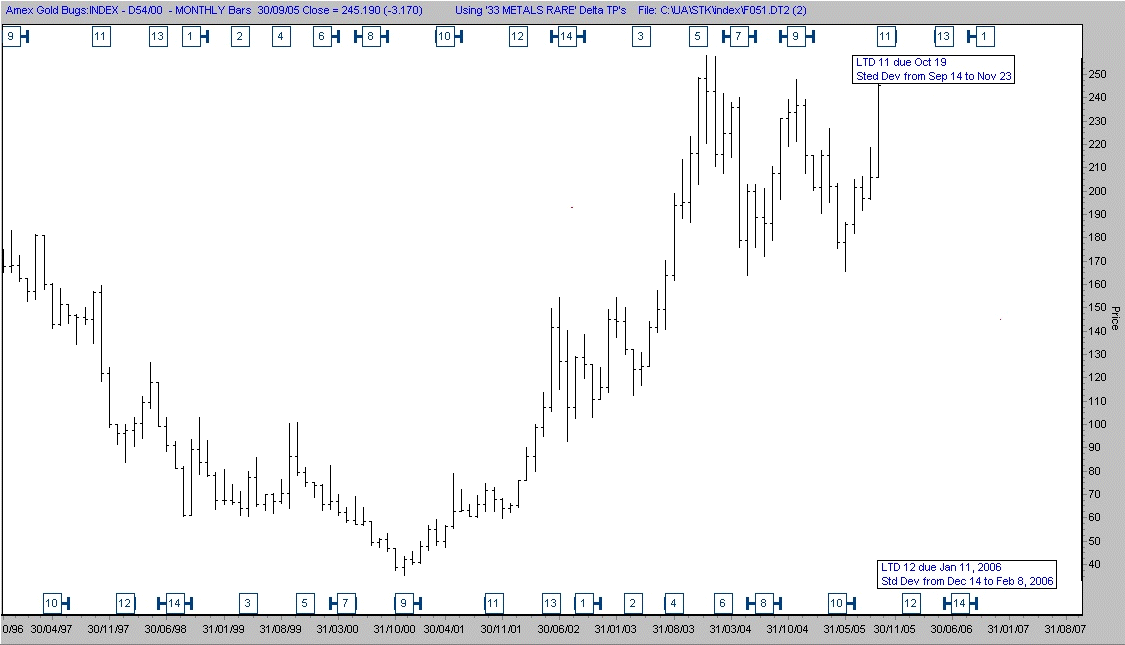
 HUI MONTHLY CHART
click image to see
chart
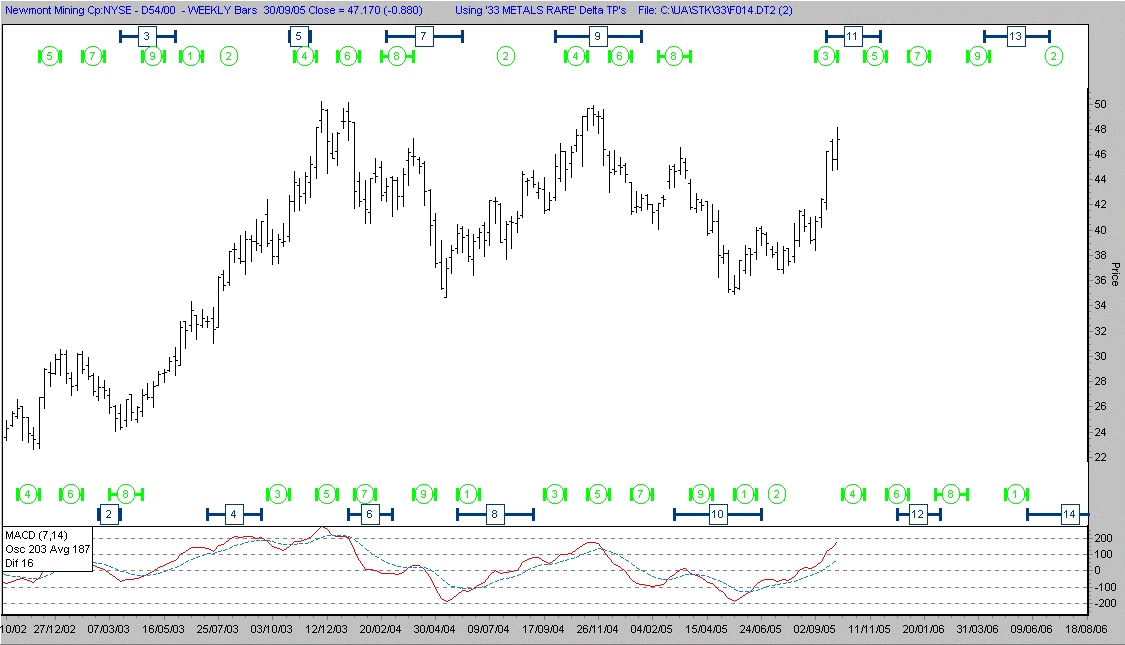
Newmont Mining
The Newmont Mining chart appears
to be duplicating the HUI chart.
NEWMONT WEEKLY CHART
click image to see
chart

Stay Well,
Oct 1, 2005
Ron Rosen
email: rrosen5@tampabay.rr.com
Subscriptions
are available at:
www.wilder-concepts.com/rosenletter.aspx
 Disclaimer: The contents of this
letter represent the opinions of Ronald L. Rosen and Alistair
Gilbert. Nothing contained herein is intended as investment
advice or recommendations for specific investment decisions, and
you should not rely on it as such. Ronald L. Rosen and Alistair
Gilbert are not registered investment advisors. Information and
analysis above are derived from sources and using methods believed
to be reliable, but Ronald L. Rosen and Alistair Gilbert cannot
accept responsibility for any trading losses you may incur as
a result of your reliance on this analysis and will not be held
liable for the consequence of reliance upon any opinion or statement
contained herein or any omission. Individuals should consult with
their broker and personal financial advisors before engaging in
any trading activities. Do your own due diligence regarding personal
investment decisions. Disclaimer: The contents of this
letter represent the opinions of Ronald L. Rosen and Alistair
Gilbert. Nothing contained herein is intended as investment
advice or recommendations for specific investment decisions, and
you should not rely on it as such. Ronald L. Rosen and Alistair
Gilbert are not registered investment advisors. Information and
analysis above are derived from sources and using methods believed
to be reliable, but Ronald L. Rosen and Alistair Gilbert cannot
accept responsibility for any trading losses you may incur as
a result of your reliance on this analysis and will not be held
liable for the consequence of reliance upon any opinion or statement
contained herein or any omission. Individuals should consult with
their broker and personal financial advisors before engaging in
any trading activities. Do your own due diligence regarding personal
investment decisions.
The Delta Story
Tee charts reproduced
courtesy of The Delta Society International.
321gold Inc

|