Precious Metals Market Timing
Draftsmans Tools
Ron Rosen
Sep 20, 2005
"Time is more important
than price; when time is up price will reverse." W.D.
Gann
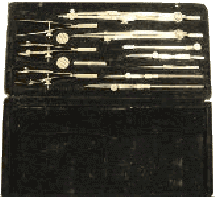
Not having the accuracy of
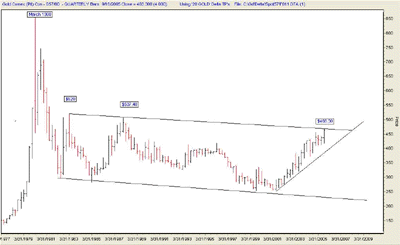
a draftsman I clearly put the trend line on the quarterly gold
chart in the wrong place. The trend line today appears more accurately
placed then the chart I posted yesterday. Break out will be a
closing price over $470 to allow for the fact that I don't make
good micro measurements. I have been using the continuation chart
which uses the most active nearest contract. It just so happens
that the most active nearest contract is the December contract.
The December contract reached a high of $ 468.30 today and closed
at $463.30. This chart shows the high price for the day not the
closing price. Spot gold closed at $459 in New York City today
and that is the price I mentioned yesterday. So we have not closed
above the $458 to $460 spot price area.
World's
most widely quoted gold spot price
The 2nd London fixing
Friday, September 16,
2005 $457.20
ac·cu·rate
adj.
Deviating only slightly or
within acceptable limits from a standard.
GOLD CONTINUATION
QUARTERLY CHART
click image to see
chart
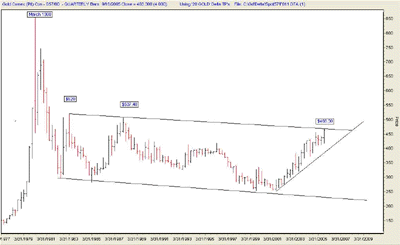 PARALLEL LINES NOT
VIOLATED. CHANNEL REMAINS INTACT.
***
QUARTERLY GOLD CONTINUATION
CHART
click image to see
chart
The gold bullion and gold share
complex have reached a point that will, most likely and soon,
provide us with the answers we want and need.
If spot gold bullion and the
HUI close at new highs for this 5 year old bull market, that
will be our signal to get aboard. The ride to heights unknown
will have begun.
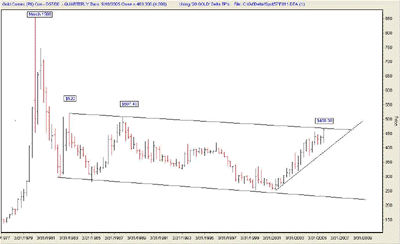
Since the quarterly chart I
am posting is using December gold futures, the break out point
is over $468.30. Let's give it a few dollars more and say a close
for the December gold contract over $470 is a 23 year break out.
The top for the HUI was 258.
Let's give the HUI a few more points and say a close over 260
is a break out.
If both Gold and the HUI close
at new highs for this bull market it will be a signal that the
next bull phase has started. The second phase is usually much
more powerful than the first.
We should enter and reenter
at that point. For those who have held on through this entire
two year correction, your doubts and pain will be over. Well,
let me put it this way; as prices rise you should start to feel
better.
I believe jumping into this
market before we have both of the break out signals may be a
mistake.
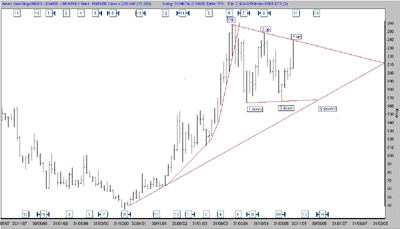
Based on the technicals, as
I interpret them, there is a high probability that Friday's high
in the HUI completed the fourth wave of a descending triangle.
If true, that means there should be one more wave down. That
fifth wave down may break the horizontal bottom line of the descending
triangle. The part that is descending is the top trend line.
The bottom is level. If the bottom line of the triangle, pictured
on the Delta HUI chart, is broken, I would expect price to retreat
to at least the area of the previous fourth wave. That area begins
at 150 on the HUI. That is the obvious support area on the chart.
If our target points for a break out hold and don't break out,
this interpretation becomes a very high probability. As of Fridays
close the HUI and gold bullion appear to have completed their
upward moves. The Delta turning points will be well aligned with
this interpretation.
The 30 year Gann cycle calls
for a bottom in gold bullion in early to mid summer 2006. One
factor that really bugs me and keeps me from believing this is
the beginning of the next bull phase is the fact that gold bullion
is leading the way. When this bull market started, the HUI led
the way up. Gold bottomed and started up about four months later.
Three years later, the HUI topped first and gold bullion topped
later. It appears to me that gold is having a weird, undecipherable
type of correction. If my interpretation is correct the shares
will bottom first and gold will bottom later. This would mean
that the shares will once again assume their normal, predictive
function. They would be predictive in that they normally lead
the way and tell us that gold will soon be bottoming and moving
up. In 2003 the HUI topped in December and warned us that gold
would be topping soon. If gold breaks out before the HUI, they
have reversed roles and that would be unusual.
We are in a fortunate technical
position. If gold and the HUI both break out to new highs, we
can assume that the highest probability is that the next bull
phase of the Precious metals complex is off and running. We can
enter or reenter the market at that time. We should expect to
immediately be met by a correction of sorts to test the previous
highs and probably a break below those highs. This will get any
sell stops that have been put too close to the line. So, be emotionally
prepared for that. I would not wait for the test of the previous
lows because these may be unusual times. The times we live in
are unusual in the sense that the National Debt of the U.S.A.
appears to be headed for a googolplex destination.
"A googolplex is the number
10 raised to the google power: 10 (googol) or 10 10 100 (1 followed
by a googol of zeros). A googolplex is much larger than the number
of atoms in the Universe."
U.S. NATIONAL DEBT CLOCK
The Outstanding Public
Debt as of 17 Sep 2005 at 10:54:54 AM GMT is:
$7,964,654,312,892.31
The estimated population
of the United States is 297,187,733
so each citizen's share of this debt is $26,800.08.
The National Debt has
continued to increase an average of
$1.66 billion per day since September 30, 2004!
***
People used to laugh about
how worthless Confederate paper money was. If the Confederacy
was still alive and their money was backed by bales of cotton
it might have greater buying power than our current Union Dollar.
Cotton is on the rise!
We are indeed in a most fortunate
position vis a vis which way the gold complex will go.
If my "techie" analysis
is wrong and the gold complex breaks out to the upside, "Old
man techie" will have served us well. "Techie"
will have provided us with an alternate view of the gold complex
that calls for another decline to a bottom. This is in contrast
to the current hysteria of the gold "bug" community.
"Techie" will have kept us from being over confident.
If "techie" turns
out to be correct and the gold complex heads down from here I
guarantee you he will be feeling smarter than warranted. However,
as soon as those feelings are under control, he will recognize
that he was in the techie "Zone" and will give thanks
to the powers above.
I can think of no better way
to mitigate a potentially wrong technical based opinion than
to call it a very low probability. Unfortunately, I can't do
that because I think it is a high probability. The really fortunate
thing is that it makes only an intellectual difference if my
"techie" opinion is wrong. Financially we will make
money if the market tells us to get aboard or save money and
avoid anxiety if it tells to stay on the sidelines. Since the
market knows more than I do, we had best listen to it.
My ego keeps whispering in
my ear, "Rosen, you are the greatest. Stand up and take
the cheers and applause because you are going to be right."
I have learned the hard way to tell my ego to shut up, put on
the Dunce cap, sit on the stool in the back of the room, and
face the wall until this is over.
So, to sum it all up, if I'm
right we save money. If I'm wrong, we make money. That's not
a bad position to be in. I haven't often found myself in that
position.
I will admit that, in view
of the dynamic moves in the gold complex, my position sounds
like it may have been written by the Twisted Sister group.
"Twisted Sister is an
American heavy metal music group specializing in the theatrical
shock metal genre popularized in music videos on the television
channel MTV in the 1980s. The group fused the shock tactics of
Alice Cooper, the rebellious mood of the New Wave of British
Heavy Metal, the chains and leather image of Judas Priest, and
the extravagant makeup of KISS. The group's hit songs include
"I Wanna Rock" and "We're Not Gonna Take It".
I don't like heavy metal music,
but I do like the position we find ourselves in.
If I'm right, we save money.
If I'm wrong, we make money. My kids used to call that, "Good
show, Dad."
MONTHLY HUI CHART
WITH DELTA TURNING POINTS
click image to see
chart
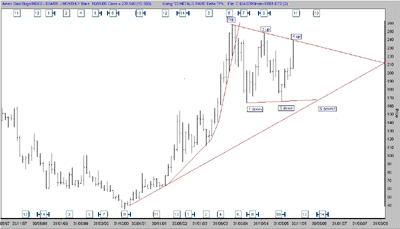 THE HUI AND GOLD
CHARTS ARE AT POTENTIAL BREAK OUT OR FAILURE POINTS.
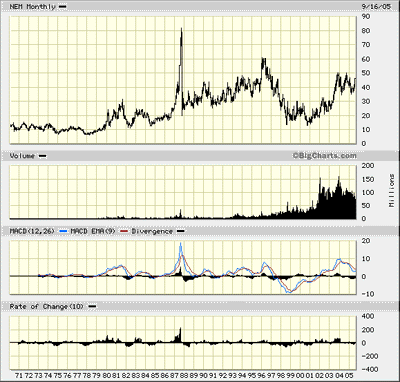
MONTHLY HUI CHART
click image to see
chart
 QUARTERLY GOLD CHART
click image to see
chart
 click image to see
chart
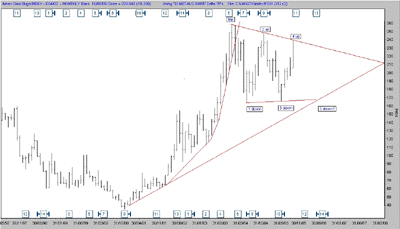
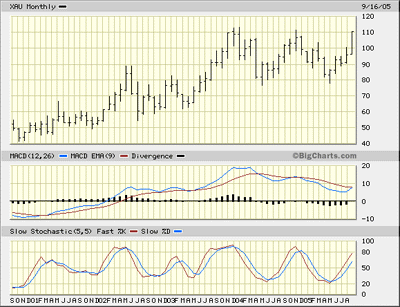
The XAU appears relatively
similar to the HUI. However, the XAU seems a lot closer to an
upside break out than does the HUI.
click image to see
chart
 click image to see
chart
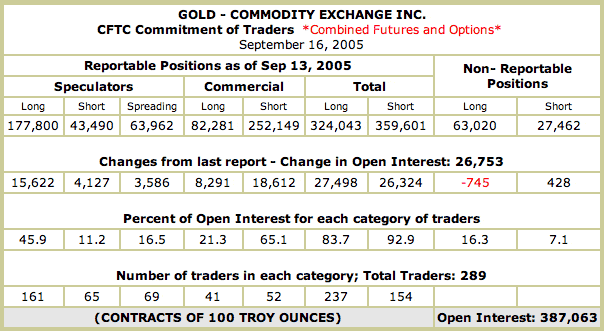
The commercials have increased
their short positions by a net 10,000. These figures are as of
Tuesday Sept 13. They do not include the activity of September
14th through the 16th.
We are getting closer and closer
to the pot of gold at the end of the Rainbow. There is only one
more thing required.
 
Stay Well,
Sep 17, 2005
Ron Rosen
email: rrosen5@tampabay.rr.com
Subscriptions
are available at:
www.wilder-concepts.com/rosenletter.aspx
 Disclaimer: The contents of this
letter represent the opinions of Ronald L. Rosen and Alistair
Gilbert. Nothing contained herein is intended as investment
advice or recommendations for specific investment decisions, and
you should not rely on it as such. Ronald L. Rosen and Alistair
Gilbert are not registered investment advisors. Information and
analysis above are derived from sources and using methods believed
to be reliable, but Ronald L. Rosen and Alistair Gilbert cannot
accept responsibility for any trading losses you may incur as
a result of your reliance on this analysis and will not be held
liable for the consequence of reliance upon any opinion or statement
contained herein or any omission. Individuals should consult with
their broker and personal financial advisors before engaging in
any trading activities. Do your own due diligence regarding personal
investment decisions. Disclaimer: The contents of this
letter represent the opinions of Ronald L. Rosen and Alistair
Gilbert. Nothing contained herein is intended as investment
advice or recommendations for specific investment decisions, and
you should not rely on it as such. Ronald L. Rosen and Alistair
Gilbert are not registered investment advisors. Information and
analysis above are derived from sources and using methods believed
to be reliable, but Ronald L. Rosen and Alistair Gilbert cannot
accept responsibility for any trading losses you may incur as
a result of your reliance on this analysis and will not be held
liable for the consequence of reliance upon any opinion or statement
contained herein or any omission. Individuals should consult with
their broker and personal financial advisors before engaging in
any trading activities. Do your own due diligence regarding personal
investment decisions.
The Delta Story
Tee charts reproduced
courtesy of The Delta Society International.
321gold Inc

|