|
|||
Precious Metals Market Timing
|

|
Otago Peninsula, Pacific Ocean,
Coast, |
Whangaroa harbor in Northland NZ. Where Patience is of the utmost importance and timing is everything. |

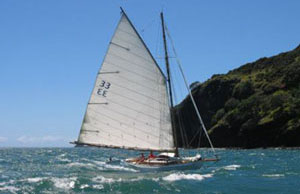
"I like it mostly because of where we were and the time too. It's entering Whangaroa harbour in Northland NZ. Whangaroa has this 200 metre wide (approx... if that) entrance and the harbor forks out into several arms with some dramatic rock formations and great shelter. We had left the cavalli islands and just loped down the 15 miles or so to Whangaroa. We were running in there against the tide and quite a chop was building up. The boats coming out were really hopping actually.
As we came in I related to the kids the story of a tragic loss there in the 80's. An NZ race yacht, Lionheart, had come back from the islands in a gale and all aboard were very ill. Under pressure from the crew, the skipper agreed to try and enter Whangaroa at night in the storm but misjudged the position of the entrance. They ran on the rocks and all crew except the skipper died. Plenty of lessons in that one. It certainly stuck in my mind. All the more tragic as 20 miles further down the coast ... another few hours and they were free and clear.
From some angles you can't see the entrance until you're virtually square off it." John B.
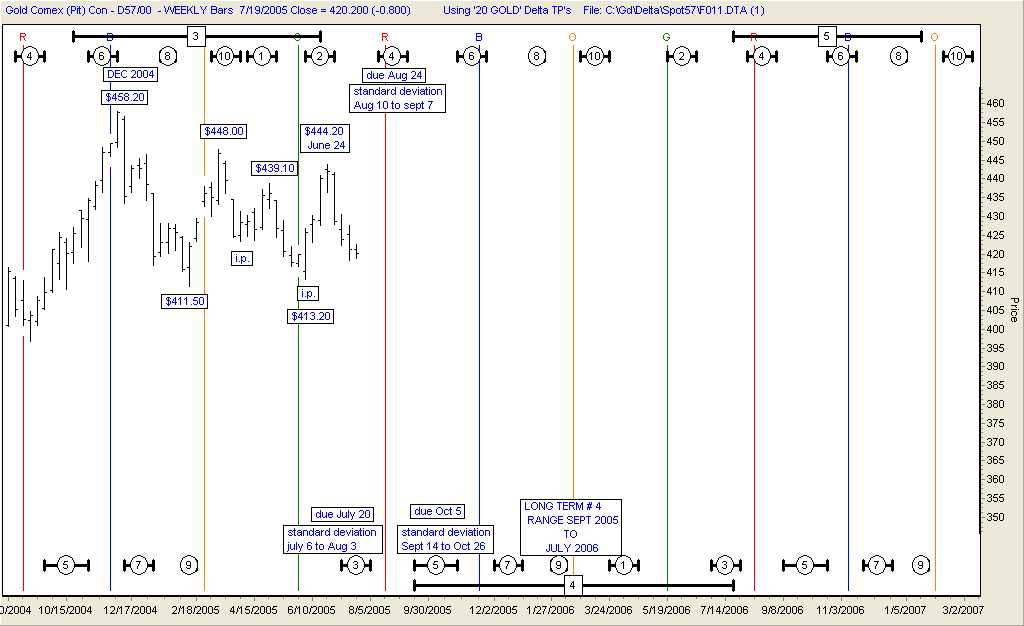
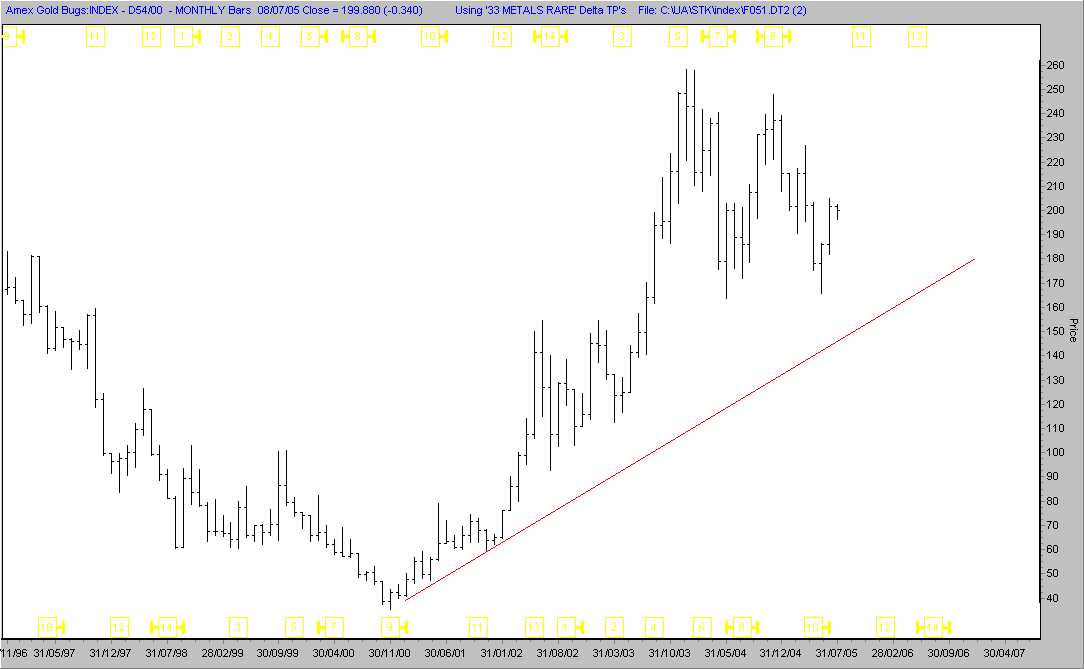
"In studying the past record of market movements, if you study the formation on a weekly or a monthly chart at extreme low levels or extreme high levels, you will get a picture that will be valuable to you in future movements. You will note the different formations before any big advance or decline takes place. The same formation at tops or bottoms or intermediate points at different times indicates the trend of the market. Therefore, when you see the same picture or formation in the market the second or third time, you know what it means and can determine the trend." -W.D.Gann
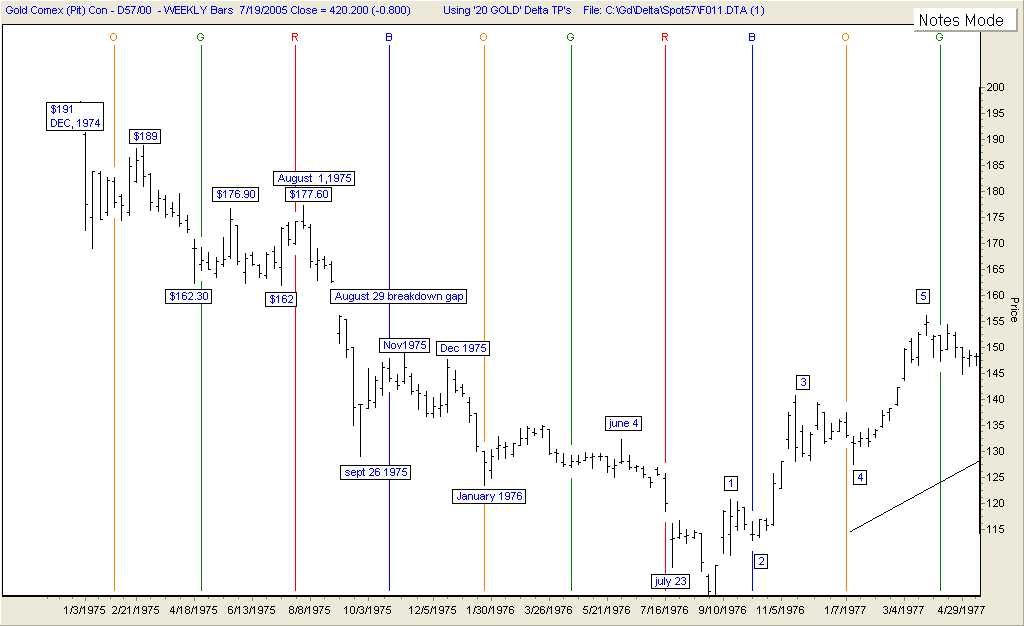
The weekly gold charts from 1975 and 2005 are a very good example of what Gann was referring to. Both charts show a peak 30 years apart. The formations at the peaks are quite similar, not exact but very similar. We know we have a Delta long term # 3 high in place and a Delta long term # 4 low due between September 2005 and July 2006. This means the pressure should be on the downside until we bottom. I have previously mentioned that October puts on Gold which expire on September 27th may be a profitable speculative way to participate in this potential sharp drop. Also remember potential is the key word so don't load up. There is a Delta medium # 4 high due August 24th with a range between August 10th and Sept 7th. I suspect medium # 4 high may arrive early because the pressure is on the down side.
There should be a rally of sorts in Gold but I doubt it will be very impressive in spite of China making some minor adjustments in its currency alignment with the dollar. This is a pure speculative play on similar patterns and timing. This approach may be too esoteric for some. If it is, waiting on the sidelines for the Precious metal shares to bottom in late summer or early fall may provide an opportunity to buy some relatively inexpensive shares. From the article above, about sailing in New Zealand waters, only the skipper survived the disaster. So, for my crew, caution and patience are the bywords. If this trade works Gold should first break below $411 and then test $400. I suspect $400 will not hold and price may go below that number. If this is a between phase correction the monthly rising trend line may be broken to the down side. I have seen many a between phase correction over the years and most manage to scare the "Devil" (or the Bull) out of the Bulls. Our alternate plan has not yet been abandoned.
Once again compare the top formations 30 years apart. The highs were made in the month of December. There are three lower highs and then a high slightly higher than the previous one.
Next report Saturday July, 23. I will post earlier if there is strong activity in the P.M. markets.
Stay Well,
Ron Rosen
email: rrosen5@tampabay.rr.com
Subscriptions
are available at:
www.wilder-concepts.com/rosenletter.aspx
![]() Disclaimer: The contents of this
letter represent the opinions of Ronald L. Rosen and Alistair
Gilbert. Nothing contained herein is intended as investment
advice or recommendations for specific investment decisions, and
you should not rely on it as such. Ronald L. Rosen and Alistair
Gilbert are not registered investment advisors. Information and
analysis above are derived from sources and using methods believed
to be reliable, but Ronald L. Rosen and Alistair Gilbert cannot
accept responsibility for any trading losses you may incur as
a result of your reliance on this analysis and will not be held
liable for the consequence of reliance upon any opinion or statement
contained herein or any omission. Individuals should consult with
their broker and personal financial advisors before engaging in
any trading activities. Do your own due diligence regarding personal
investment decisions.
Disclaimer: The contents of this
letter represent the opinions of Ronald L. Rosen and Alistair
Gilbert. Nothing contained herein is intended as investment
advice or recommendations for specific investment decisions, and
you should not rely on it as such. Ronald L. Rosen and Alistair
Gilbert are not registered investment advisors. Information and
analysis above are derived from sources and using methods believed
to be reliable, but Ronald L. Rosen and Alistair Gilbert cannot
accept responsibility for any trading losses you may incur as
a result of your reliance on this analysis and will not be held
liable for the consequence of reliance upon any opinion or statement
contained herein or any omission. Individuals should consult with
their broker and personal financial advisors before engaging in
any trading activities. Do your own due diligence regarding personal
investment decisions.
Tee charts reproduced courtesy of The Delta Society International.
321gold Inc
![]()