 Precious Metals Market Timing Precious Metals Market Timing
The HUI and Gold Bullion
Ron Rosen
Jun 1, 2005
"Time is more important
than price; when time is up price will reverse" -W.D.
Gann
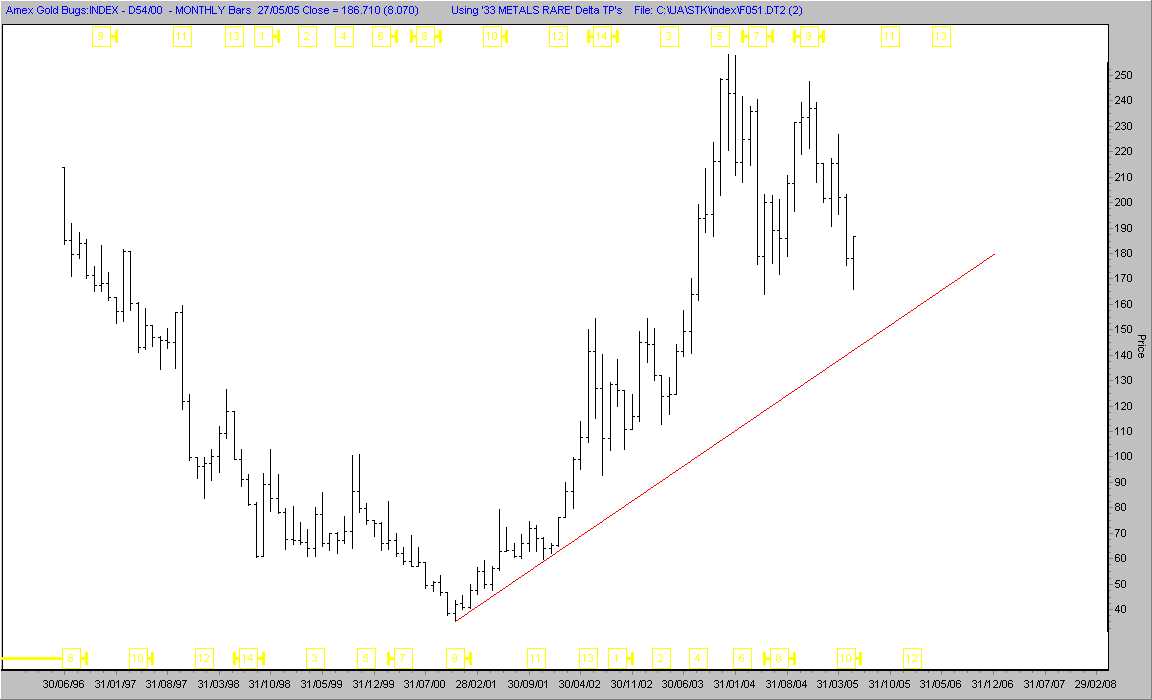
In the HUI charts above you
can see that wave B topped approximately 15 points below the
high of the complete bull move. This presents us with the probability
that Wave C will bottom approximately 15 points below Wave A.
If so that would make the bottom around 150 which would touch
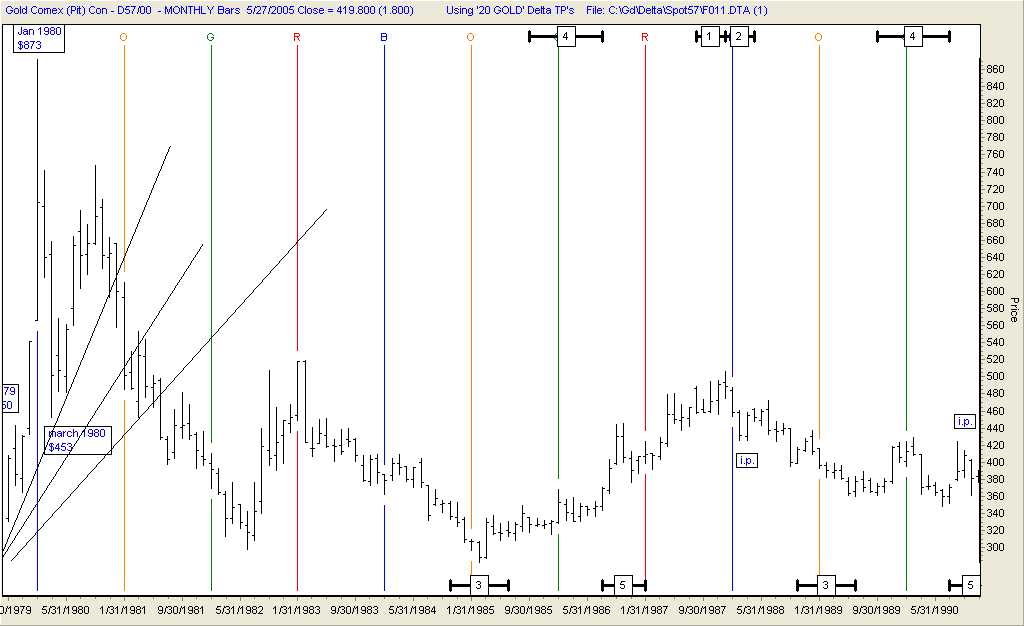
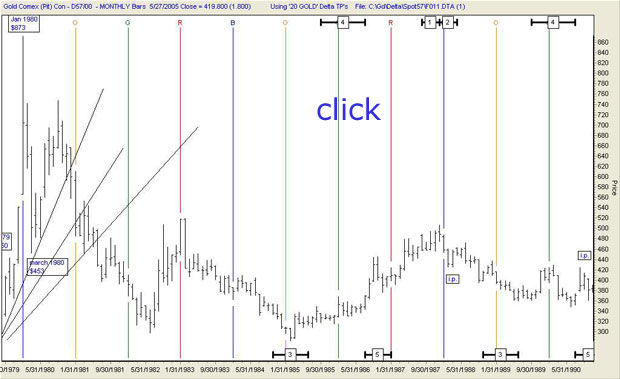
the very long term uptrend line. However a breaking of the long
term trend line would likely flush out any remaining doubters
and is a good probability. You can see the long term trend line
on the monthly chart.
Once again "Patience"
is required to allow this correction to fully express itself.
There will be a bottom to this correction and we will have a
pretty good idea when it arrives. It will still have to be proven
that this coming bottom is the bottom we have been waiting for.
Bottom picking has not been a profitable activity, so we wait
and watch and don't guess that a bottom is here. The over enthusiastic
gold bugs can mislead folks all the way to the bottom. There
are ways to determine to a very high probability that the true
bottom has arrived. I have said this before, "The bottom
is proven to have been obvious on the way UP not on the way down."
"It is probably fairly
obvious that corrective waves can be extremely confusing and
can confound even the most experienced analyst. As a result,
the analyst is advised not to use Elliott in isolation."
We do not use Elliott waves
in isolation. We use them in conjunction with Gann cyclic studies
and Delta turning points. Together they are three of the most
powerful technical market tools available.
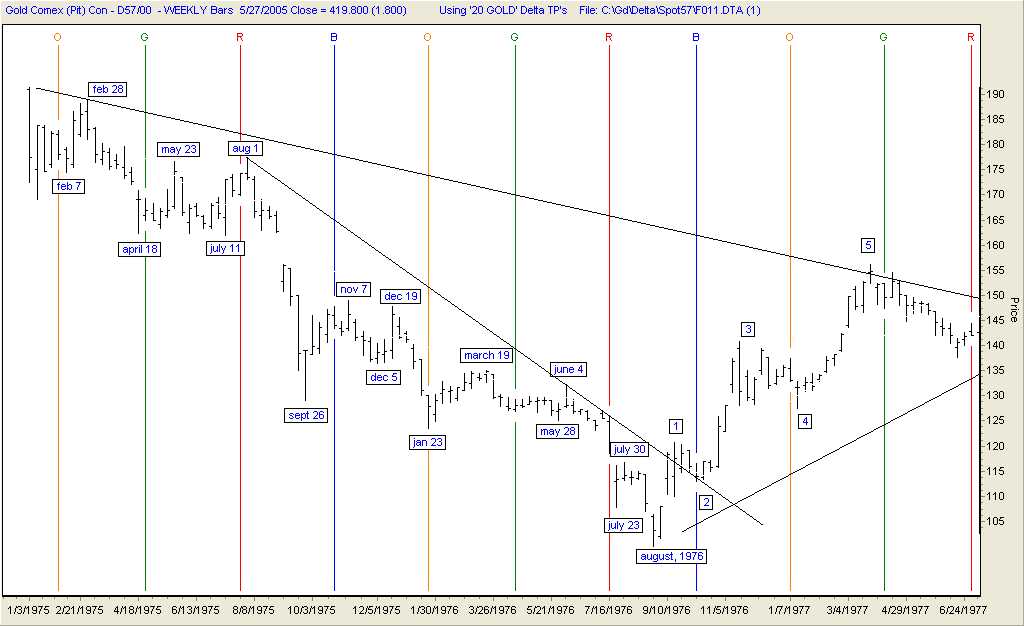
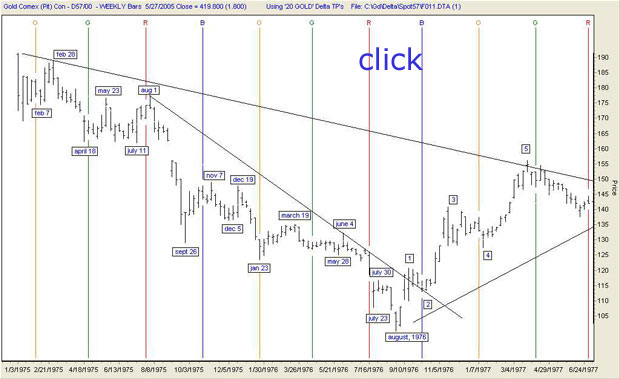
GOLD WEEKLY
JAN 1975 HIGH TO AUG 1976 bottom
**see notes below
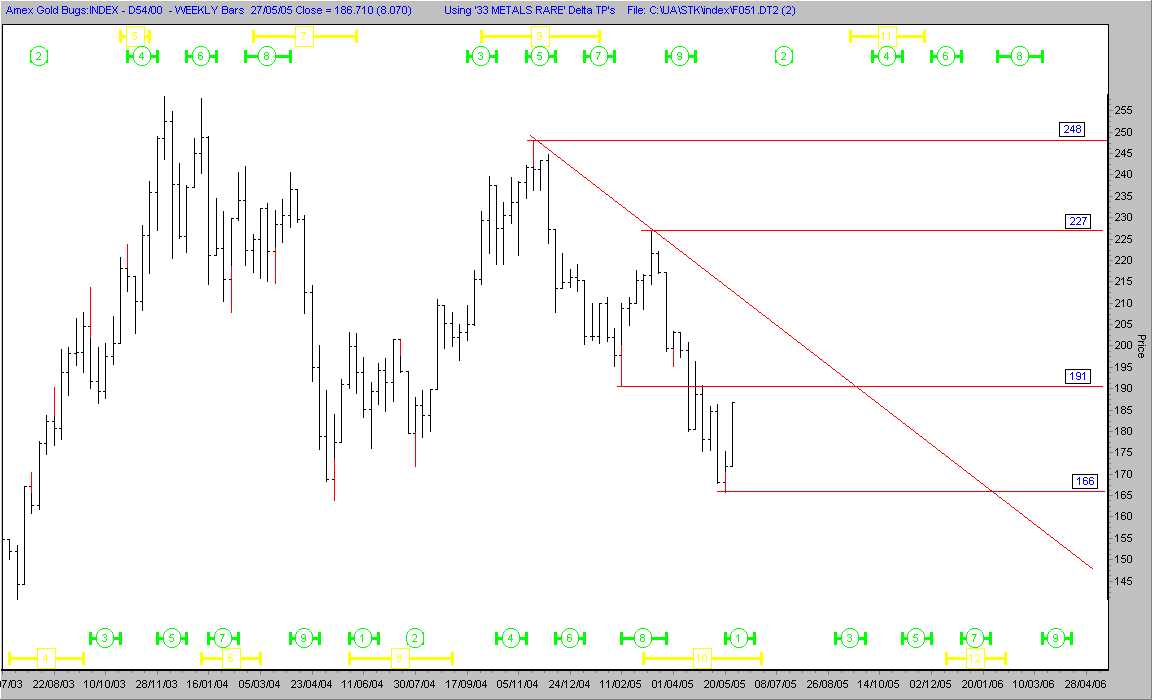
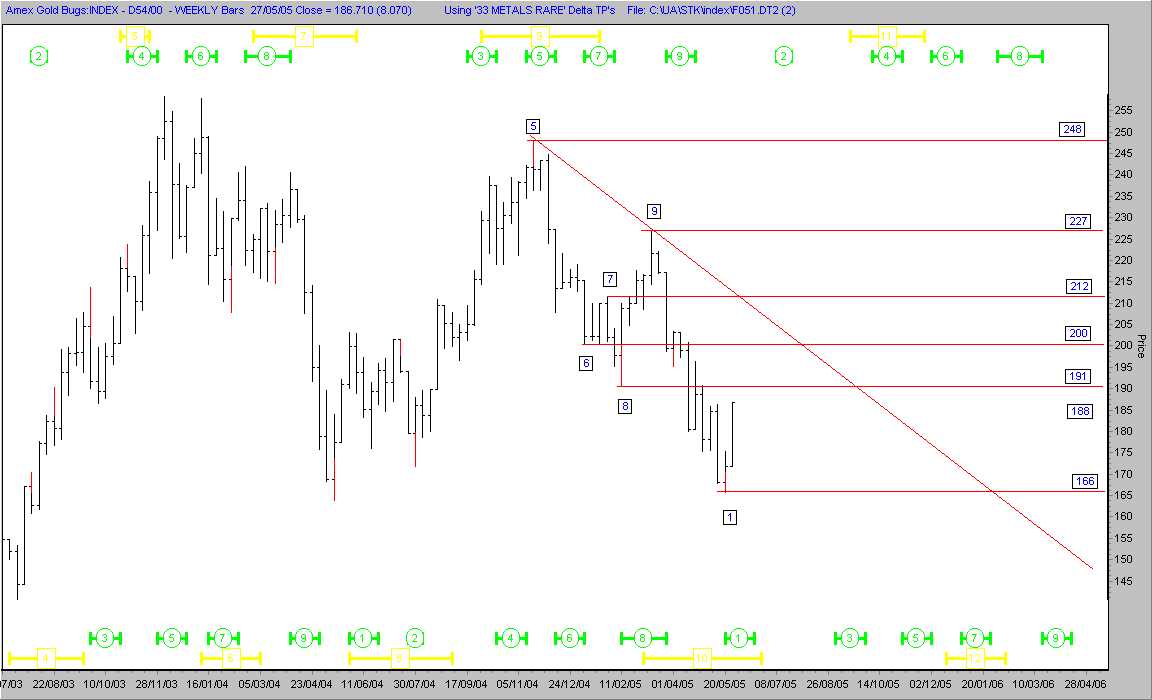
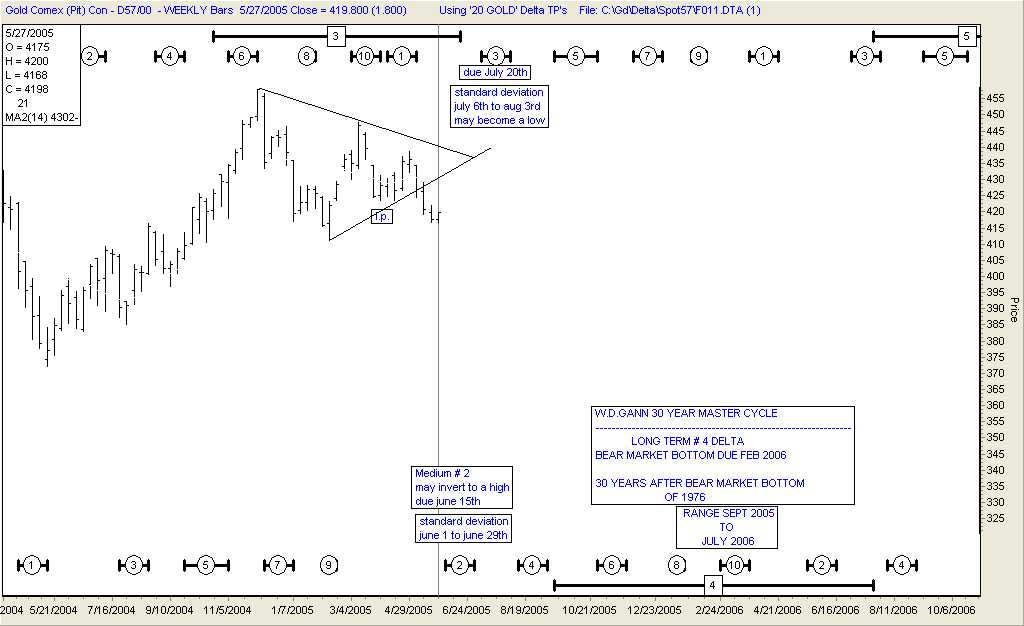
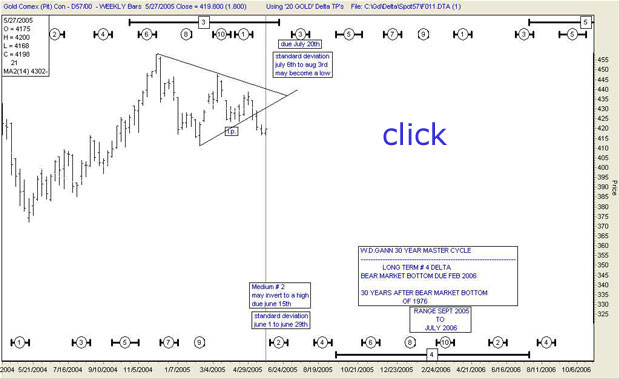
 GOLD WEEKLY
DEC 2004 HIGH TO LOW IN (SEE RANGE BOTTOM OF CHART)
 GOLD MONTHLY
1980
 **Gold topped in Jan 1975and
a serious correction followed. 30 years later, within day's,
gold topped in 2004 and we have been experiencing a correction
ever since. We don't know how serious this correction will be
but according to long term Delta turning points it will take
many months and possibly not bottom until summer of 2006. So
far this is a Gann cyclic study worth the time spent studying.
I have said this before also, "Believing it works is the
hard part."
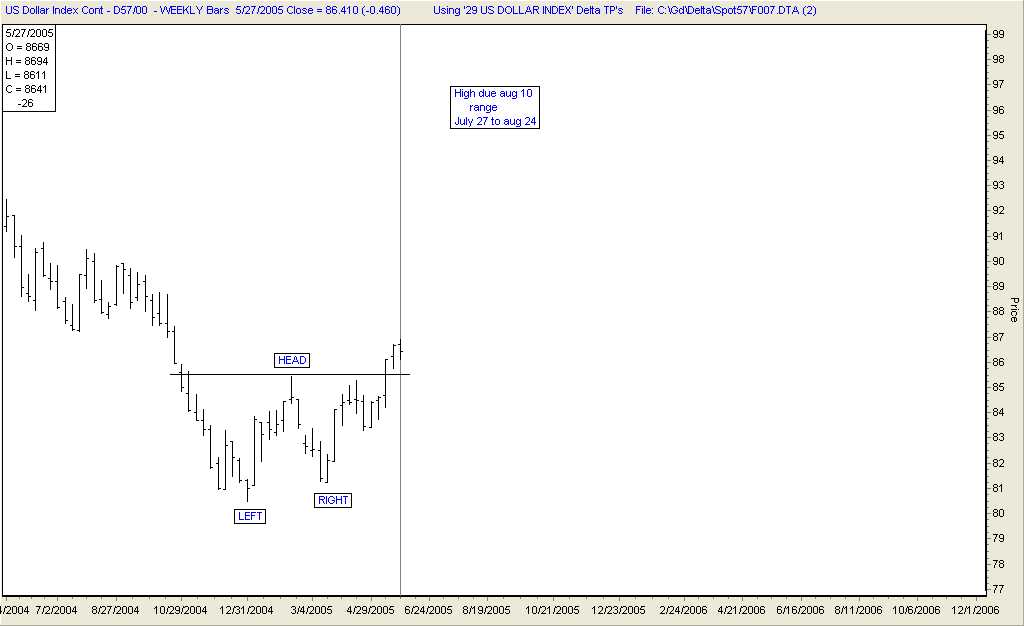
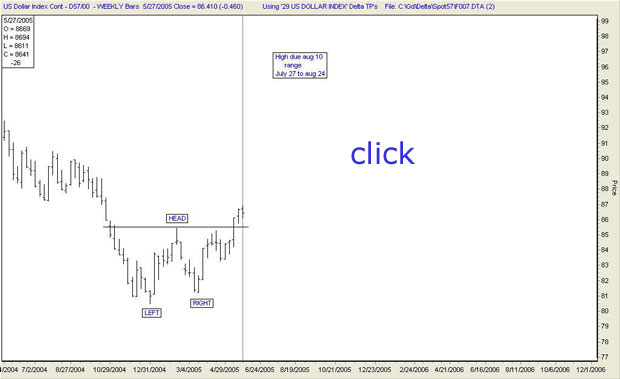
*The U.S.Dollar has shown us
the direction it was going to take over seven months ago. It
has formed and completed a perfect reverse head and shoulders
pattern. You can see this on the weekly chart.
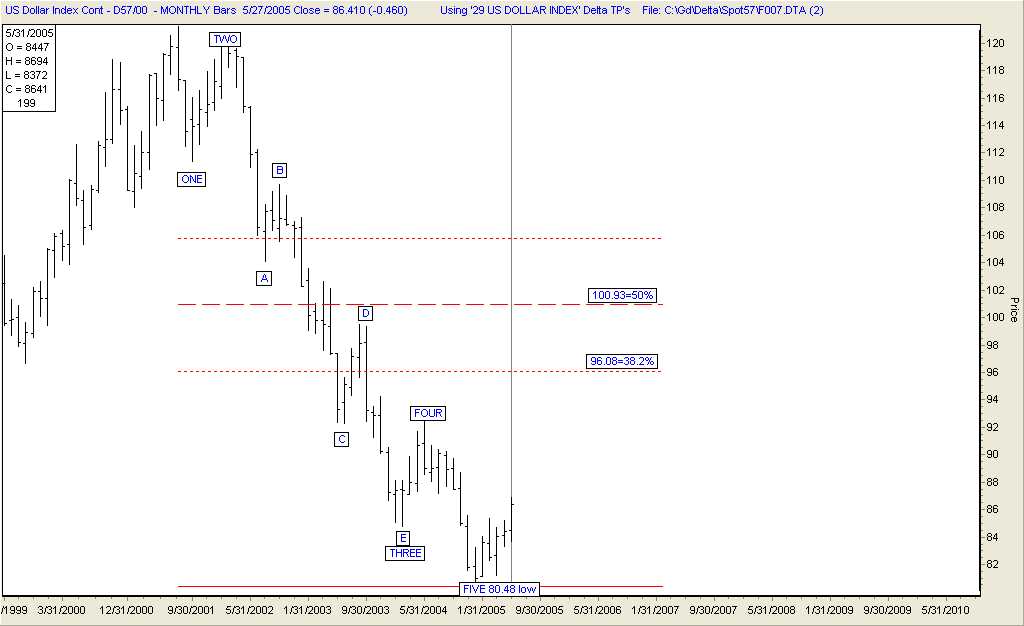
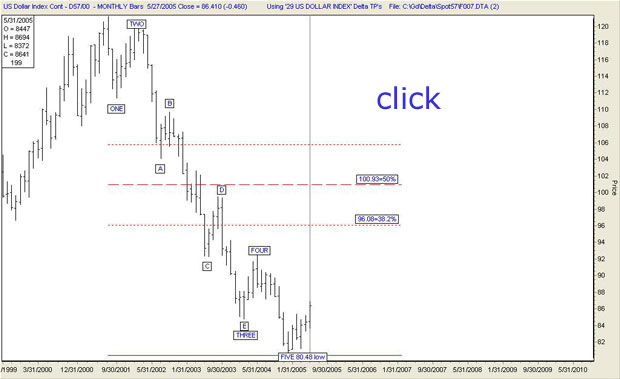
(*)The monthly chart shows
us a bear market that has completed a 5 wave move. This is a
near perfect 5 wave Elliott pattern.
U.S.DOLLAR
WEEKLY *
 U.S.DOLLAR
MONTHLY (*)
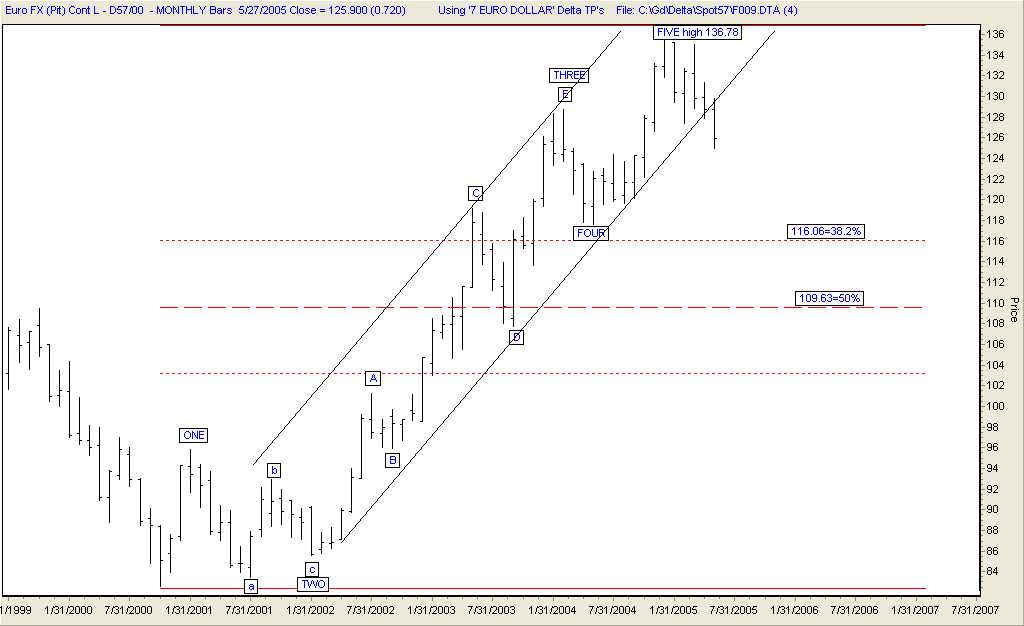
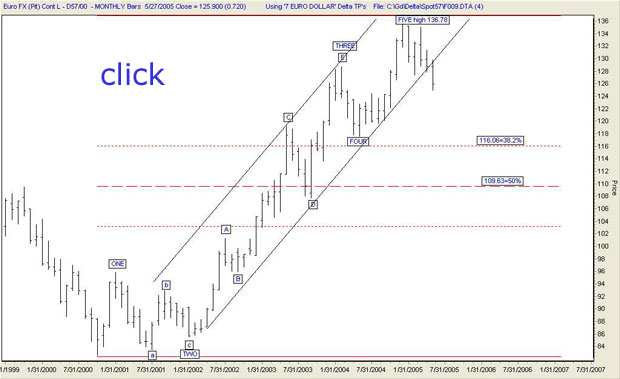
 The Euro, the Dollars counterpart,
completes the picture. The Euro also completed a near perfect
Elliott Wave bull move. You can see the five wave pattern clearly
on the monthly chart below.
EURO MONTHLY
 To summarize, using Delta turning
points, Gann cyclic studies and Elliott monthly wave counts we
have kept ourselves on the correct side of the Precious metals
complex, so far.
I will be doing my best to
announce "ALL ABOARD" when the time seems appropriate
according to these three tools and the 50 years of observations
I have spent time gathering. I might add a good portion of those
50 years were spent learning from mistakes. I suspect there are
more mistakes lurking out there and because of this I keep looking
over my shoulder. Hopefully this approach will keep us all out
of financial "harms way!"
Stay Well,
A subscription to Precious
Metals Market Timing may be obtained at www.trade-delta.com
or contact rrosen5@tampabay.rr.com
Jun 1, 2005
Ron Rosen
email: rrosen5@tampabay.rr.com
Subscriptions
are available at:
www.wilder-concepts.com/rosenletter.aspx
 Disclaimer: The contents of this
letter represent the opinions of Ronald L. Rosen and Alistair
Gilbert. Nothing contained herein is intended as investment
advice or recommendations for specific investment decisions, and
you should not rely on it as such. Ronald L. Rosen and Alistair
Gilbert are not registered investment advisors. Information and
analysis above are derived from sources and using methods believed
to be reliable, but Ronald L. Rosen and Alistair Gilbert cannot
accept responsibility for any trading losses you may incur as
a result of your reliance on this analysis and will not be held
liable for the consequence of reliance upon any opinion or statement
contained herein or any omission. Individuals should consult with
their broker and personal financial advisors before engaging in
any trading activities. Do your own due diligence regarding personal
investment decisions. Disclaimer: The contents of this
letter represent the opinions of Ronald L. Rosen and Alistair
Gilbert. Nothing contained herein is intended as investment
advice or recommendations for specific investment decisions, and
you should not rely on it as such. Ronald L. Rosen and Alistair
Gilbert are not registered investment advisors. Information and
analysis above are derived from sources and using methods believed
to be reliable, but Ronald L. Rosen and Alistair Gilbert cannot
accept responsibility for any trading losses you may incur as
a result of your reliance on this analysis and will not be held
liable for the consequence of reliance upon any opinion or statement
contained herein or any omission. Individuals should consult with
their broker and personal financial advisors before engaging in
any trading activities. Do your own due diligence regarding personal
investment decisions.
The Delta Story
Tee charts reproduced
courtesy of The Delta Society International.
321gold Inc

|