|
|||||||
Gold Action #410Dr. Clive Roffey
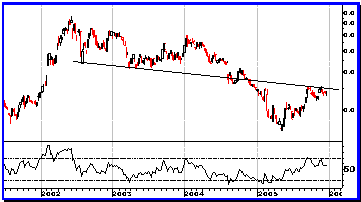
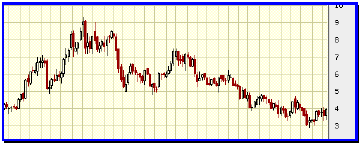
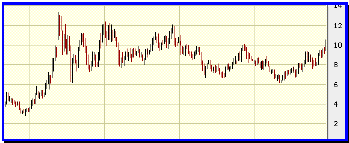
Whilst the gold price and shares took a breather, so did I!!. The beach at Muizenberg in Cape Town is as delightful as ever, and just as windy!! But is an ideal place in which to relax and recharge the batteries after a helter-skelter year. I must admit to a laugh last week. When the gold price was roaring away to $540 suddenly there was a plethora of analysis, from people who were previously conspicuous by their silence, raving about the upside potential for gold. As usual when the press and TV herd latch onto a story it is right at the end of the move and in typical fashion the gold price fell $50 almost immediately!! The Resource sectors have rebounded from their lows this year to mount a serious bull charge. At the start of 2005 and throughout the whole of the year I have been rating the resource sectors as the main investment area and the dominant part of portfolio selection. The JSE Resource index followed by Metals and Minerals and Gold were the top main sector performers for the year. Sure there were individual sectors that outgunned them but in terms of the main sectors of the market the resource orientated sectors were the place to be. It has been a nice Xmas and Chanukah present. Unfortunately the golds slid quite nastily from January to May but have since recovered very sharply to end the year over 50% up. But my main piece of analysis of which I am most proud is the continued Elliott Wave analysis of the gold price. Whilst most analysts have been calling the gold price down the whole year and continuously looking for corrections back to $310, 400, and now $450 I have maintained that bullion was into a nine wave extended format that had a long way to go to well above $600 before it hit its main target and final end of the nine waves. I remain massively bullish on both the gold price in $ and Rand as well as the gold shares. In my analysis the gold shares have not even started their long term bull market move into the third wave. One of my other main contentions during 2005 was that the April 2002 peak in the gold shares represented the end of wave I in Elliott and that the three year correction back to May 2005 was wave II. I have constantly detailed that the next bull run in wave III for the gold shares MUST take the JSE gold index, and individual share prices (including DROOY), well above the top of their April 2002 peaks. This implies that I must look for at least a 100% return on gold shares in 2006. Although this is one of my forecasts for 2006 that I will deal with in the next issue, I am happy to place it on record a little early. My main concern lies with the Dow and its current refusal to break above the major resistance level at 11 400. Whilst the New York Stock Exchange index has risen to clear new highs the Dow has failed to match this performance and the S&P remains well under its former highs. This is setting up for a classic Elliott B wave mechanism as the precursor to a serious C wave sell off. The only way in which the general equity markets can prevent such a catastrophic event is for both the DJIA and S&P to move into new high ground in the very near future. Silver remains my main precious metal to outperform both gold and platinum. I continue to look to silver stocks to provide the price catapults in a market that I believe will yield over 100% returns during the coming year. So on that note let me wish you all a very Resourceful and Golden 2006. 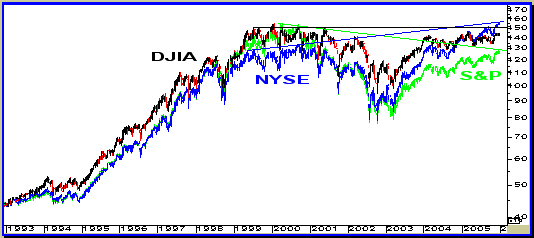 This is the chart that is giving me headaches. The NYSE in blue has made a clear new high whilst the DJIA battles the 11400 overhead selling resistance and the S&P lags behind both of them. IN a true bull market they should all be making new highs together. This is one of he signals in Elliott that the markets are not in a new bull trend but a B wave market rally. For this data to become positive both the DJIA and S&P must move to new highs very soon in the New Year. A failure to do this and a drop under 10000for the Dow will signal disaster for general equities. The NASDAQ and the leading Euro indexes reflect the movement of the S&P and are nowhere near to making new highs. 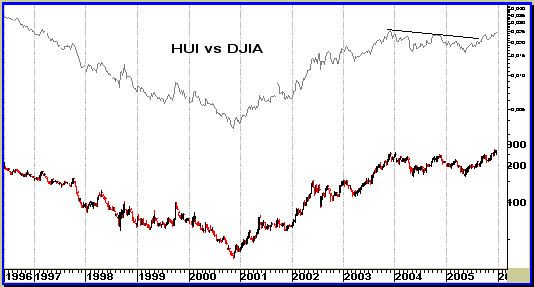 Meanwhile the HUI continues to forge ahead to new highs as well as progressively outperforming the DJIA, S&P and NYSE indexes.  I rate this as the chart for 2006. It is the CRB index of commodity prices. Last week this chart, after two years of sideways churning, broke upside and signalled its intentions to move into a new bull phase. This is confirmed by the upside break on the RSI oscillator in the bottom frame. The grey line in the top frame is the relative strength of the CRB against the DJIA. For the past three years it has performed at the same rate as the general equity index. But this pattern is about to change and the drawn out triangle make a significant break. I am looking for an upside breakout and this will signal a serious commodity price surge that should outgun general equities. Lead, Aluminium and Zinc have all made serious upside breakouts. But I look to the grains for the real action in commodities. 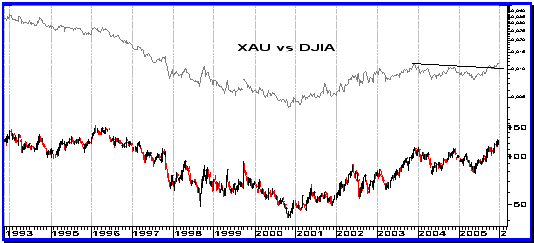 Meanwhile the XAU precious metal share index continues to power in front of the DJIA as shown in the grey chart. This is a major bull market in gold and silver stocks and do not be swayed by any short term negativity. This long term bull market has only just started.  This is my Elliott Wave analysis that I have constantly detailed in its nine wave format. Whilst most analysts during this strong bull market have looked for serious corrections I have steadfastly maintained that this is a strong bull market with an extended wave format. Compare the recent rise and fall in bullion with the dotted lines of my projections. Not too bad a forecast. But the fact that the gold price accelerated away to hit the top trend line may force me to revise my analysis away from the 7-8 correction if the gold price quickly rebounds and goes through the $540 peak in the near future. If the gold price rapidly recovers back above $540 then I would have to become even more bullish. But I prefer to wait for this event before detailing further analysis. Irrespective of the short term machinations this remains a very bullish chart.  How many times did I detail the seven wave format of GFI and its upside potential breakout from the rectangular pattern? It has not only broken out of the pattern but also moved to new highs signalling the start of major wave III in Elliott. This is the market leader and indicates much more upside potential for the gold stocks. This is a long term investment chart, not a trading situation.
24 December,
2005 'Gold & Silver Penny Stocks' is the sister publication to 'Gold Action' and is produced by Dr. Clive Roffey; croffey@mweb.co.za
|

