|
|||||||||||||||||||||||||||||||
Gold Action
#407
|
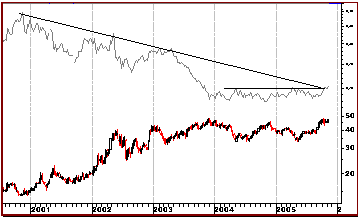 |
The ASA chart is shown with its relative strength against the HUI index. This South African dominated investment trust is clearly breaking upside out of a serious relative strength base in grey. For the past five years it has underperformed the general gold indexes but it is ready to really bounce off this base and produce a superior performance. |
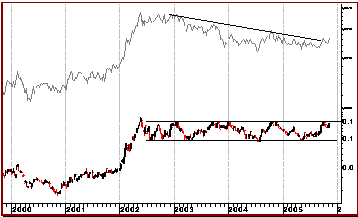 |
Goldfields is shown relative to the XAU index. I have frequently detailed the huge sideways trading pattern that has dominated the share price for the past three years. But the key is the grey relative strength data that clearly indicates an upside break against the North American gold index. This is likely to lead to a very strong performance period for this leading gold producer. |
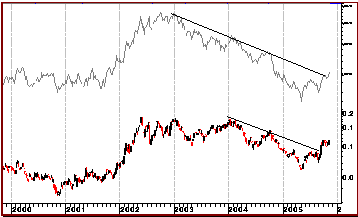 |
Harmony has also turned the corner and broken a strong downtrend of under performance against the HUI index shown in grey. In fact for the past few months Harmony has already been outperforming the North American gold indexes. |
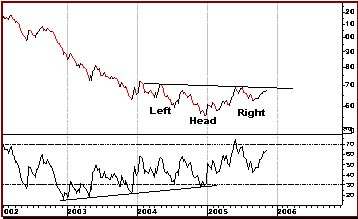 |
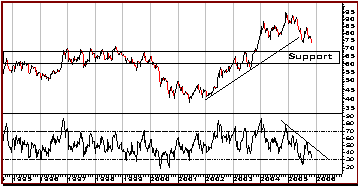
The Rand / Dollar chart has a potential reverse head and shoulders top pattern. Last issue I detailed that a move by the Rand to break under R6.70 will indicate a serious weakening of the currency for the next few months. If the neckline of the head and shoulders pattern is broken it will trigger a weakening currency to R8.20. But in addition there is also huge buy divergence for the Dollar against the Rand. I continue, as I have done since the start of this year to look for the Rand to be one of the world's weakest currencies. |
 |
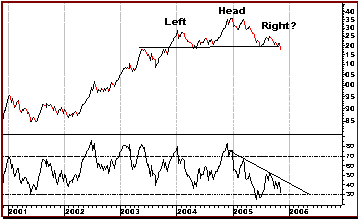
Sterling is showing distinct signs of weakness against the Dollar. There is a head and shoulders top pattern and a downside count to 1.65. There is strong support for Sterling at 1.65. In addition the RSI still has further downside to come. As the following Euro chart also shows, the Dollar is likely to remain strong for some time against most leading currencies. |
 |
The Euro / $ chart has a potential head and shoulders top pattern. The neckline has been broken to the downside and triggered a fall by the Euro to a target count of E1.08. At this point of time the RSI has not yet confirmed the new recent low and that remains of concern. But the key to this weekly chart is the trend line on the RSI. I do not expect to see any significant Euro strength until this trend line has been broken to the upside. I must remain bullish on the Dollar. |
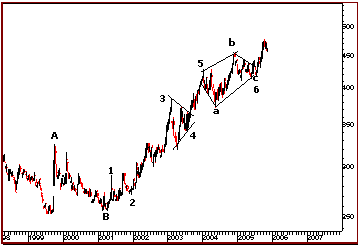 |
How can gold go up if there is to be a strong $????? I reproduce my Elliott wave analysis of bullion that I first published in 2002 and have continuously updated. We are nowhere near to the top of the current bull run. Out of the diamond pattern at 5-6 the upside count gives $515. Then there is the long term full count to $620 that I believe will be achieved next year and signal the top to this bull run that started in 2001. If my Elliott analysis is correct then I will maintain my stand that we will see a strong dollar, weak Rand and strong precious metal prices. |
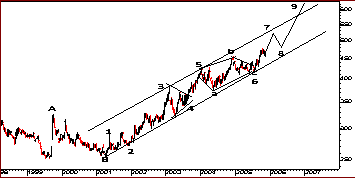 |
This is my updated Elliott Wave analysis of the gold price. I am looking for a run to $515 around the end of the year followed by a short correction that will constitute the 7-8 move before the final surge into the top at 9. This top should breach $600 and also push above the top channel line of the trend that started in 2001. This will be a classic blow off signal and end the big bull run for the time being some time late next year. |
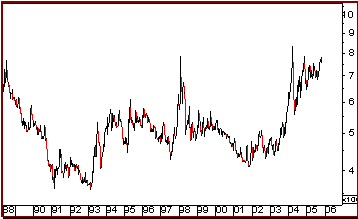 |
But of all the precious metal charts Silver remains my favorite. The upside count out of this powerful base is at least $12 before we even start to be concerned about the long term bull market. This is a 50% potential move and I look for a similar move on gold. Focus on the long term data, or at least to the end of next year. This next leg is when all the doubters enter the market and drive prices as though there was no tomorrow. Meanwhile investors already in the market make the profits. |
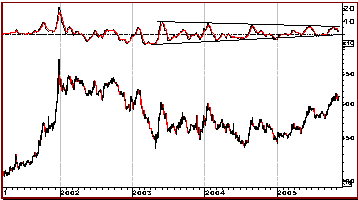 |
The Rand price of gold is starting to accelerate. It is shown with its long term MACD. The point to note is the triangular pattern on the MACD. An upside break in the long term picture will lead to an explosion in the Rand price of gold. Watch this data. |
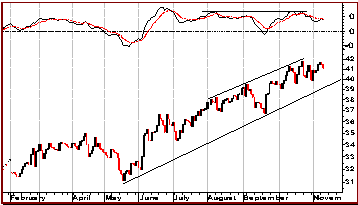 |
Copper is showing the first real signs of weakness for a long time. The MACD is refusing to confirm the recent highs and signaling a downside reaction period. There is strong support at 39 and this would also constitute a pullback to the main support line of the trading channel. I am expecting a short term period of weakness in the copper price. |
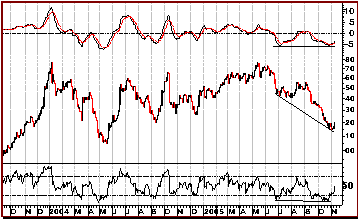 |
However nickel is a different matter. I would switch out of copper contracts into nickel. There are two major buy divergences on the price data related to the MACD and RSI oscillators. This implies that the recent strong downside price reaction is ready for a trend reversal. I like nickel. |
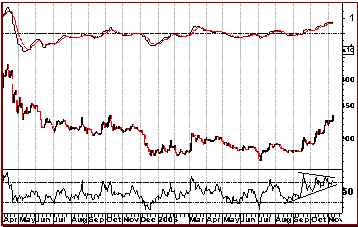 |
How many times over the past nine months have I detailed that the price of Palladium was ready for a serious upside bull run and likely to out perform the price of platinum? This is happening and this minor precious metal remains a major bull market contender. |
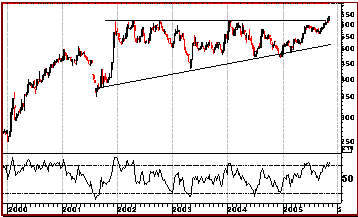 |
The Rand price of Platinum price has been inside a flat top triangle for the past three years. It has just broken upside. This infers a rising dollar metal price coupled with a falling Rand. There are no signs of any sell divergence on the RSI. This remains a very bullish picture for both the Rand price of platinum and the mining stocks. |
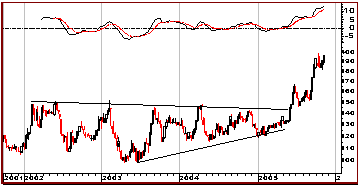 |
The Gold price in Euros has already broken to new highs out of the triangular pattern that I have so often detailed in past issues. There are no signs of an MACD sell divergences. This remains a very bullish picture. The bottom line is for a continued bull run in bullion against all currencies and for the South Africans to out perform the rest of the gold market. |
URGENT NOTICE
I shall be visiting the UK for a couple of weeks from November 24th to attend my eldest son's graduation for his MBA at Oxford University.
I will produce the next Share Action and Gold Action fortnightly newsletters next week but not again until the weekend of December 10th.
I will endeavor to produce the daily data and the weekly 50% and Gold & Silver Penny Stock newsletters whilst in the UK.
November 12th 2005
Dr. Clive
Roffey
Johannesburg
South Africa
email: info@utm.co.za
Roffey archives
"Gold Action"
is a fortnightly commentary on global gold and precious metal
markets produced by Dr. Clive Roffey, Johannesburg, South Africa,
a leading professional independent commentator on gold markets
since 1969.
'Gold & Silver Penny Stocks' is the sister publication to 'Gold Action' and is produced by Dr. Clive Roffey; croffey@mweb.co.za
| Recent Gold/Silver/$$$ essays at 321gold: Feb 20 Silver North Hits Best Hole in Their History in Yukon Bob Moriarty 321gold Feb 19 ESGold Moves to Production Alongside Exploration Bob Moriarty 321gold Feb 17 A Bull Era: Robots & Gold Stewart Thomson 321gold Feb 15 Bitcoin, Stock Market & Gold captainewave 321gold Feb 15 L@@K Amazon Kindle and Paperback Books by... Bob Moriarty 321gold Feb 13 Gold Stock Cash Cows: Buy The Dip Morris Hubbartt 321gold |
