|
|||||||||||||||||||||||||||||||
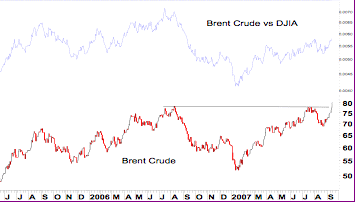
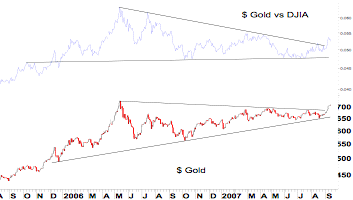
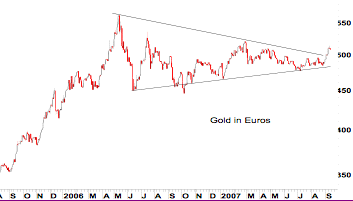
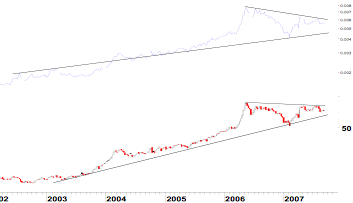
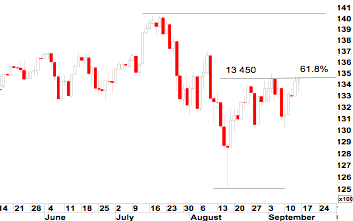
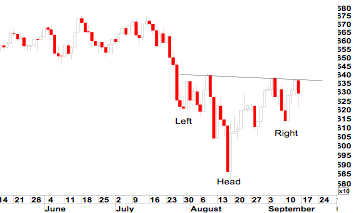
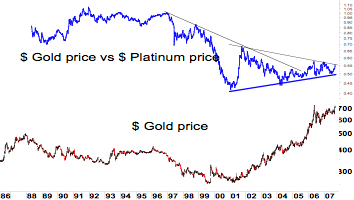
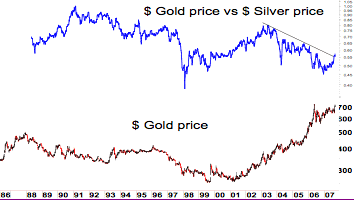
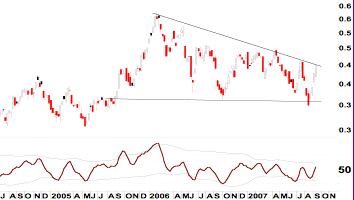
Gold Action #446Dr. Clive Roffey Without doubt the lead story of the past two weeks has been the surge in the gold price as it broke upside out of the large triangular patterns that had confined it for the past 18 months. I have continuously detailed these triangular formations that have been in progress on the gold price in every leading global currency. Breakouts from triangles have a special significance. During the formation of the pattern the fundamentals are uncertain and the price bounces up and down reflecting this indecision and hesitancy. But at the point of breakout all the uncertainty is resolved into a new set of fundamentals that dominate the next upward surge. A large degree of the uncertainty stemmed from the sub-prime rate problems in the US. The tidal wave effect of this crisis caused doubts to be cast on the future direction of consumer spending and global growth. However the central banking system has made it abundantly clear that they have rallied round to cut rates in order to attempt to alleviate the major effects of the sub-prime debacle. I attended a very interesting presentation a week ago at the monthly TASSA (Technical Analyst's Society of Southern Africa) meeting that discussed the sub-prime difficulties and the reasons for the debacle. According to the speaker it transpired that financial houses in the US bundled together parcels of BBB rated bonds and somehow persuaded the rating agencies such as Standard & Poor, Moods and Fisk to rate them as an AAA risk. The bottom line is that this is tantamount to fraud. The spin off from this rate fiasco is that the rating agencies have some fast talking to do in order to repair their status. Irrespective of the reasons the gold price against all leading currencies has broken upside out of the triangular patterns with a typical surge. The full implication is that gold has once again become the centre pivot of the currency system and there is a worldwide flight to protection. When the triangular breakout on the bullion price is transposed onto the share charts there are some huge potential upsides out of the massive 18 month period of churning. My long term counts indicate that over the next three years we could easily see a trebling of share prices if not greater leverage. Meanwhile the Dow bounced back upside to hit the 61.8% retracement level of 13 450 on the nail before moving into a churning pattern. I remain bullish on global equities and continue to look for the Dow to hit my long term target of 15 500. A new push above the resistance level at 13 400 will confirm the continuation of the major bull trend. As I have so often detailed, sudden falls in stock prices are usually the final C wave sell off from an old correction and not the start of a new bear market. I stick to this analysis for the equity sell off. I rate it as a serious buying opportunity and not a period in which to panic. As expected Brent crude oil has penetrated the $80 a barrel mark and the base metal prices are ready for the next bull run after their period of consolidation. All my data continues to point to the resources arena as the performing sector of the market but you should keep an eye on the financials if they start to break above their short term resistance levels.
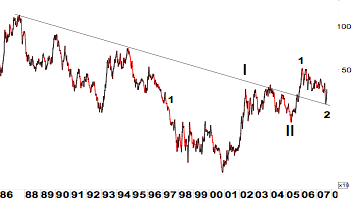
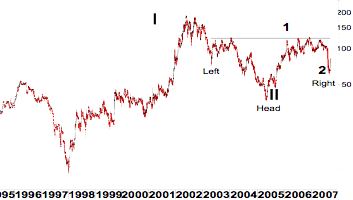
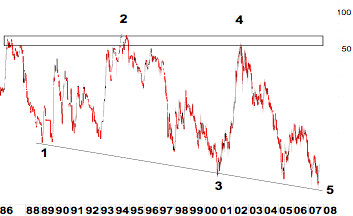
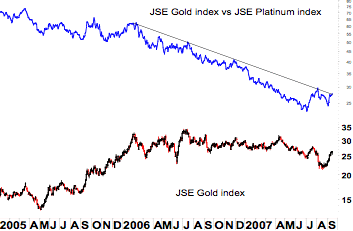
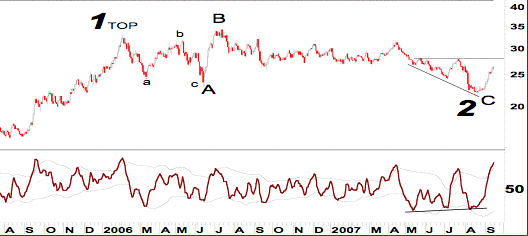 The JSE Gold index in Rands has an awful lot to its chart. The first aspect is the large irregular Elliott A-B-C correction that is the first correction 1-2 in big wave III. Second it must be noted that the low of wave C only just went under that of wave A. This is Elliott configurations is a weak correction and heralds a strong forward move. The third aspect is the flat top broadening pattern at the end of wave C that I have so often detailed in this report and all the daily data. This broadening pattern still has to break above the top resistance at 2800. When it does so it will trigger a minimum upside count to 3500 on the index. Finally there was a serious buy divergence on the RSI that accompanied the broadening pattern indicating a reversal of trend. This trend reversal is not just the end of the immediate downside sell-off but the end of the 18 month total correction and is the start of the new move into wave 3 that, according to Elliott, MUST break back well above the top of wave 1. 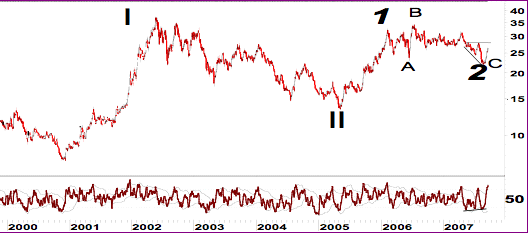 This chart puts the big I-II and recent 18 month 1-2 corrections into perspective on the JSE Gold index. 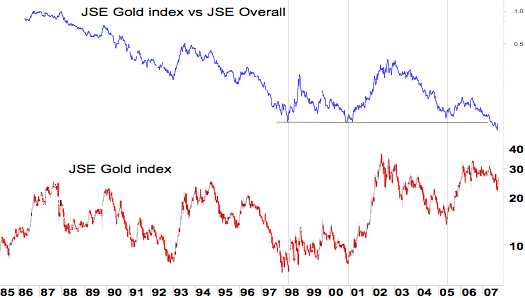 The JSE gold index is compared to the JSE Overall index. This is an interesting chart from several aspects. There is no doubt that the blue relative strength line has underperformed the general equity index for the past 22 years. In fact it is at its lowest oversold ebb ever. But it is interesting to note that every time the index has hit the low levels there has been a strong upside reaction in the index. This occurred in 1998, again in late 2000 and more recently in 2005. The implication is that relative to the general equity market the gold shares are massively oversold and that a strong relative strength reversal can be expected. The 1998 bounce produced a rise of 130% in the index whilst the surge from late 2000 yielded a 500% move and the more recent 2005 lift off resulted in a 110% increase. The 1998 to 2000 period move of 130% was during a base formation. Whereas the 2005 upside was a smaller move up to wave 1 of the new bull trend. The big 500% move was in the first true leg of the bull market and we are about to move into wave 3 of another big bull leg. Traditionally wave 3 is the longest and strongest leg of the Elliott five wave configurations. Thus we have entered a far more serious move in terms of Elliott and I would expect a rise well in excess of the 100% levels and more towards the 300% probability. This is a new MAJOR BULL market and not a minor move. We are only into wave 3 of big wave III and there this wave 3 followed by the final wave 5 still to be completed. AND that is only the end of wave III. After a reasonable correction in wave IV there is still the large wave V to come. I must reiterate that this is a LONG TERM MASSIVE bull market in gold that has several YEARS to run.
Sep 16, 2007 'Gold & Silver Penny Stocks' is the sister publication to 'Gold Action' and is produced by Dr. Clive Roffey; croffey@mweb.co.za
321gold Ltd |