|
|||||||||||||||||||
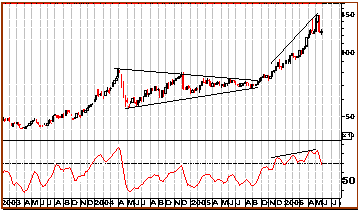
Gold Action #421Dr. Clive Roffey It appears that one of compulsory attributes for the post of would be President or Prime Minister is So comrade Zokwane, president of the National Union of Mineworkers has, in support of Jacob Zuma, confirmed that the left wing COSATU unions do not "adhere" to Judaic / Christian principles and they "do not listen" to the ten commandments. He specifically referred to adultery. I presume that this also extends to "Thou shalt not steal" and "Thou shalt not kill". No wonder with such blatantly outdated Marxist immoral precepts South Africa is the rape, AIDS, murder and theft capital of the world. A month ago I sent out an extra report detailing all the leading global equity indexes and the huge number of sell divergences that were evident. Since then we have seen a sudden sell off in these markets. It is difficult for me to become bullish on global equities and I must look for any upside reaction to be classified as merely a rally in a new ongoing bear market. But the data for resource stocks and particularly gold shares is the exact opposite. Whereas for the past few years the general equities have been forming major potential top patterns with sell divergences the resource markets have been in bottoming patterns and are ready for some further serious lift off. I classify the recent dip in resources as a necessary correction to cool off a very overheated situation. I rate this as a correction in an ongoing bull market that will take resource shares to new high ground. The gold price rose some $45 above my oft stated count target of $685 and then fell $45 under this to react. This is a typical swing in the gold market. What ever level the price reaches above the target so will it correct under the target. In my work we have completed an Elliott Wave Irregular top in bullion with the classic killer C wave sell off. This has completed and the next bull movement should start right now. My target for the next phase is $850 with a possible extension if the trend is powerful to $930. In the meantime who would have thought that DRD was a classic example of a bull market. The reverse head and shoulders pattern is ready to break upside and catapult the stock to my target of R21 from its current R10.50 for a 100% potential gain. The same picture is shown by the chart of Harmony. For the pat few months the gold shares failed to make new highs with the gold price. This divergence has ended in my analysis. I am now looking for the gold share to resume their roles as the market leaders and to out perform the gold price in both Dollars and Rands. I do not apologize for ignoring the general equities in my analyses and for focusing on the resource sectors. Take a good look at any relative strength data and you will see that resources are where the market strength lies, not with general equities. For some time I have looked at the Rand chart as a major double top pattern in which the R5.95 was the topping out area. I have continuously analyzed that a break of the R6.18 resistance would lead to a sharp weakening of the Rand against all major currencies. The collapse from R6.05 to R6.65 in a few days is exactly what I expected. I am looking for a period of relative stability for the currency at the R6.50 level and not for further immediate weakness although there is an eventual probability that the R6.85 level will be tested. The financial managers are so under weight resources and hugely overweight banks and retailers that eventually they will be forced by lack of performance to increase their exposure to the gold market. That should provide the real performance ratings. I rate the current gold and resource price levels as serious buying positions for a powerful upside move into the top of these markets by the end of the year. The next six months could be the most gain orientated period of 2006 for investment portfolios with a heavy gold and resource exposure.  Since the large double bottom pattern in 199 to 2001 the $ price of gold has made a continuous series of new highs as would be expected in a bull market. Since the middle of last year the price accelerated. The whole point of this analysis is to point out that the RSI in the bottom frame has made a series of new highs commensurate with those on the bullion price. This data classifies it as a stable bull trend. There is no sign of any sell divergence. The implication is that the recent gyrations are merely a minor correction in an ongoing long term bull market.  I have updated my Elliott Wave analysis. I was expecting a run through to minor wave 9 to complete the rise from the middle of last year. This ensuing correction has completed the 7-8 major correction in the current large extended nine wave bull market since 2001. There is still one more wave to come in this bull run that should, in my analysis take the price above that of January 1980 and the $850 peak. I am looking for around $930 on bullion to complete the first massive bull leg of a long term major bull market. This is the final euphoric wave in which I expect to see every man and his dog become experts on the gold market and levels of well above $2000 an ounce forecast. This is the wave in which financial managers at last become bullish and the unwary are sucked into the easy profits right at the top of the run. I expect to see at least a 100% appreciation in the gold shares. I expect to see serious ell divergence materialize at the top of this run. Until then remain fully invested in this gold market.
May 28, 2006 'Gold & Silver Penny Stocks' is the sister publication to 'Gold Action' and is produced by Dr. Clive Roffey; croffey@mweb.co.za
|


