Gold Action
#421
Dr. Clive Roffey
May 15,
2006
It appears that one
of the compulsory attributes for the post of would be
President or Prime Minister is a good dose of stupidity. In South
Africa deposed Deputy President Jacob Zuma was cleared of rape
charges but ridiculed for his attitude to AIDS and his now infamous
retort that as he showered after unprotected sex with an HIV
positive lady he was saved from catching the disease. In a similar
vein Gordon Brown, the UK Prime Minister in waiting, was the
idiot who sold most of the UK gold reserves at the bottom of
the market. It does not take too much analytical savvy to see
that if his political decisions are as wise as his investment
ones he will not last long in office.
Meanwhile the resources boom
goes on and on and on. Calling tops in runaway markets is the
most difficult analytical conundrum.
I am being inundated from all
quarters of the globe with analyses on how high the gold price
can go from commentators that were conspicuous by their silence
before gold hit $600. This concerns me as when the euphoria really
grabs hold it is time to take profit action. For the past two
years I have detailed that distrust of the dollar as an investment
currency, the growth in Indian jewelry off take, China's massive
middle class explosion for gold investment coupled with the potential
for Chinese reserves to dramatically increase, as well as global
political instability would be the driving forces for gold's
move. Not inflation. Suddenly I find that all these new boys
on the block have belatedly discovered these arguments.
But in total contrast the general
mood relating to gold shares over the past two months has been
one of negativity as the shares have failed to match the rise
in the gold price in both dollars and rands. The fallacious hype
goes like this. The gold price is too high and must correct.
Therefore the shares will correct more and so I should be taking
profits out of my gold share holdings and not buying. Wrong decision.
I love it. These amateur psychologists
do not understand markets. Markets bottom out,
they do not top out, on negative attitudes. Markets
peak on euphoria, when every man and his dog suddenly becomes
an expert on the market and it is the easiest way in town to
make money. We are nowhere near that process for the gold stocks.
My analysis indicates that
$750 is a short term target for the gold price. A year ago I
produced a 70 page report for a leading mining house on the long
term future for gold and I came to the conclusion that the market
still has a hell of a way to go in both price and time. The 2013
to 2016 area appears to be the potential final topping out time
frame for the gold price with levels of at least $1650 to a possible
$2350 as the likely target area. But frankly at this stage these
prognostications are not of any consequence except to reaffirm
the long term investment nature of
this gold bull market.
Most finance houses have been
left for dead by the resources surge. They are so underweight
resources that it is ludicrous. They are the main protagonists
of the 'gold shares cannot move as the gold price is too high
and must correct' dogma. They are still locked into the retailers
and banks doctrine and are anti-gold thus missing out on one
of the biggest bull markets in history. When these fund managers
start to publicly recommend gold stocks to their poor clients,
as they eventually will, it will then be time to seriously consider
taking profits. Until this scenario evolves relax and enjoy the
ride.
Finally the Dow is pushing
to new highs. I am not sure whether I trust it at this point
of time. I want to see a more substantive performance before
committing to a new bull market and a further 4000 points rise
over the potential double top pattern. The recent 100+ points
per day falls reinforces my doubts about the bullishness of the
Dow.
From a gold share perspective
the Rand is the most important data at this point of time. I
am looking for a reversal of effects from now on. Previously
we saw the gold price in both Dollars and Rands roaring to new
highs whilst the shares remained stagnant. I expect this to change
dramatically. I look for the gold price to gyrate between $695
and $760 for the next period but with a very much weaker Rand.
This will send the SA gold stocks into orbit. DRD has already
signalled its intentions by a 25% rise in just two trading sessions,
and this is only the start of the breakout.
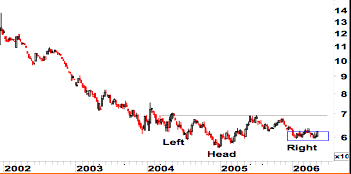 |
The Dollar / Rand chart has formed a potential reverse head and
shoulders pattern to which I have alluded in previous issues.
More recently the right shoulder has formed a double bottom inside
the blue rectangle. This is a potentially large reversal pattern
from four years of strength reverting back to a significant period
of weakness. That will certainly kick start the gold shares.
But let's focus on the right shoulder in the next chart. |
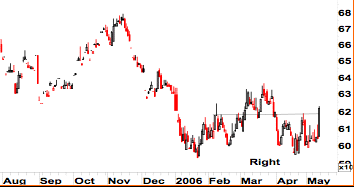 |
The right shoulder of the above Dollar / Rand
chart is detailed. For some time I have been discussing the resistance
level at R6.18 that has held the second bottom of the double
bottom in place. However on Friday this chart rocketed off this
R6.05 base toe close above R6.20. This is a massive move and
one that should send shivers down the spines of importers. I
believe that the double bottom is complete and that the currency
will weaken towards a target level of R6.80. |
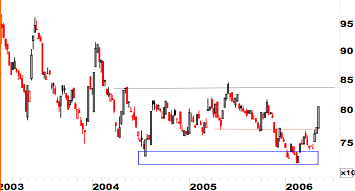 |
The Euro / Rand has also formed a double
bottom pattern inside the blue rectangle. There is a serious
reverse head and shoulders pattern that has formed over the past
few months and I detailed this data on a recent Roffey Review.
But the key is the upside charge on Friday. The currency has
shot above the R7.70 neckline and is set for a move to at least
R8.40 to the Euro. This is again a serious potential base formation
and a nasty one for importers. |
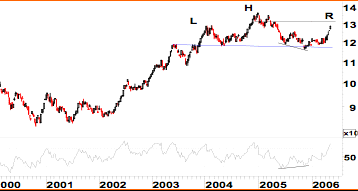 |
The Euro / Dollar is being analysed by many as a potential head
and shoulders top pattern with the recent Euro strength forming
the right shoulder. I do not subscribe to this concept, but exactly
the opposite. There was a clear buy divergence in November as
the Euro bounced off the 116 level. If the supposed right shoulder
moves above 132 then this will negate to formation as a top and
indicate it as a continuation pattern with an upside count to
at least 145. |
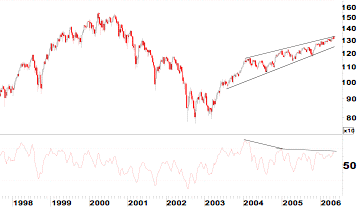 |
The US indexes concern me. The S&P 500
has been in a three year rising pennant that has produced steady
but not spectacular growth. But when I look at the total no confirmation
of the RSI to mirror any on the new highs over this period I
become extremely cautious. Although the Dow has attacked its
previous all time high the broader S&P is still way under
its 2000 peak. I must continue to rate the whole of the upside
move from 2002 as a major B wave in an A-B-C long term bear market.
The problem is that we still have the major C wave sell off to
come. I remain nervous of global equities. |
 |
The Rand price of Oil is in a major bull
market. I have previously detailed that this bull run is only
just starting and that local industry must sit up and take notice.
I am looking for at least another 35% increase in this data.
Transport costs will go through the roof. |
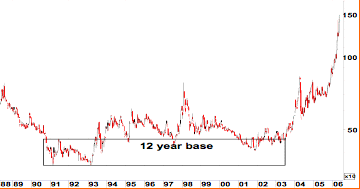 |
How many times did I detail this rectangle on
the Silver chart? How many times did I refer to it as
a 12 year base pattern that would subtend a huge upside potential?
I come back to basic charting. The bigger the base the larger
the upside. It is a most frustrating experience to sit whilst
bases are forming. But once the lift off occurs it is well worth
the wait. The reason I detail Silver is just to illustrate the
fact that ALL the metals are rocketing off huge bases. |
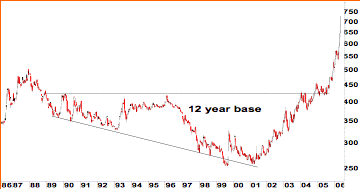 |
Gold
also had a 12 year base pattern in the form of a flat top broadening
formation compared to the classic fulcrum of Silver. But the
implications are the same a dynamic bull market once the breakout
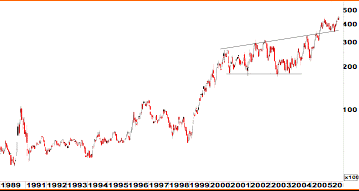
occurs. Take a look at the same bases on Nickel and Lead and
you will see that they have only just started their runs. |
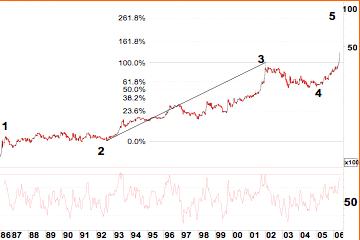 |
The Rand price of gold has always been a key factor in my gold analysis.
I believe that it is into its long term fifth and final leg of
a huge bull market. It has already smashed well above the previous
2001 high but there are no signs of any sell divergences. In
addition the RSI is not yet at the total danger level of previous
bull market peaks. I have always looked for a R5400 an ounce
price that translates to R175000 rand a kilo. BUT my total upside
target for this data is to R8400 an ounce in the years to come.
At this point of time even a price close to R5000 an ounce will
set these gold shares rocketing. |
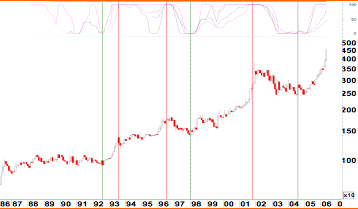 |
This is my long term monthly price chart of the
Rand price of gold with my proprietary oscillators. You
will note that every time the oscillators group together at the
top of their range I get a sell signal on the red vertical. Every
green vertical is the grouped oscillator buy signal. Currently
the oscillators are spread well apart and not yet grouping at
the top of their ranges. This is a LONG TERM chart. It implies
that in the LONG TERM there is still further upside potential
for gold so that any corrections that occur will be great buying
areas. |
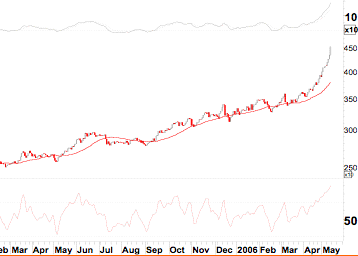 |
As most readers know I am not a great fan of
moving averages as buy and sell operators due to the time lag.
But in a roaring bull market they often play an important role
as support levels. The price usually pulls back to the MA and
uses it as a support area. In the case of the daily Rand price
of gold the RSI is close to 90 and that is extremely overbought.
But there is no sign of any sell divergence implying that the
bull run is stable. I expect a sideways drift as a corrective
phase to slow the price advance whilst the moving average plays
catch up rather than a sudden price crash. |
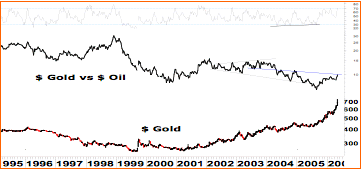 |
The chart of gold vs oil is reversing.
For the past 7 years gold has underperformed oil. But there is
a huge divergence buy on the oscillator in the top frame and
this indicates that the gold price will out perform oil. This
relative strength data indicates a total reversal of strength
out of oil and into gold. This applies to ALL metals. Commodity
players will find that oil will be the inferior performer relative
to all metals. |
May 14, 2006
Dr. Clive Roffey
Johannesburg
South Africa
email: info@utm.co.za
Roffey archives
"Gold Action"
is a fortnightly commentary on global gold and precious metal
markets produced by Dr. Clive Roffey, Johannesburg, South Africa,
a leading professional independent commentator on gold markets
since 1969.
'Gold &
Silver Penny Stocks' is the sister publication to 'Gold Action'
and is produced by Dr. Clive Roffey; croffey@mweb.co.za
Recent Gold/Silver/$$$ essays at 321gold:
Jul 31 Gold Stocks: Finding A Technical Floor Morris Hubbartt 321gold
Jul 31 Gold's Bullish Falling Wedge Adam Hamilton 321gold
Jul 31 FYI Canadian Markets are closed Monday for Civic Holiday 321gold
Jul 30 FYI 321gold is 25 years old today 321gold smile
Jul 28 The Global Theme Is A Golden Dream Stewart Thomson 321gold
Jul 27 L@@K Amazon Kindle and Paperback Books by... Bob Moriarty 321gold
|
321gold Inc

|
