| |||
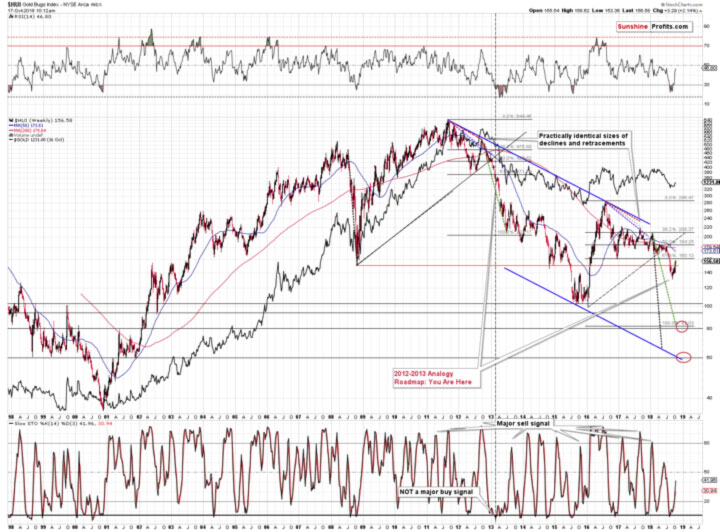
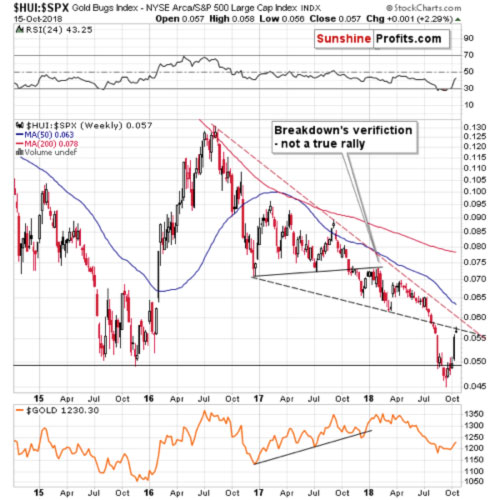
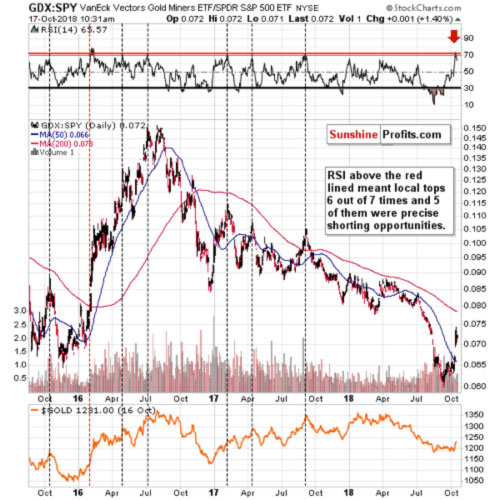
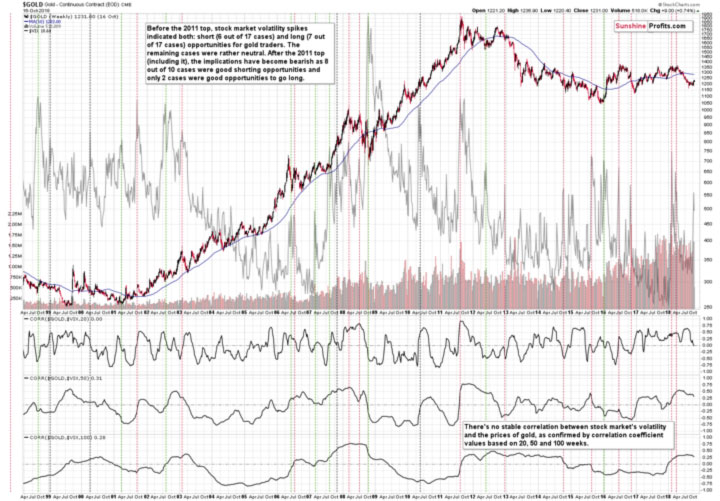
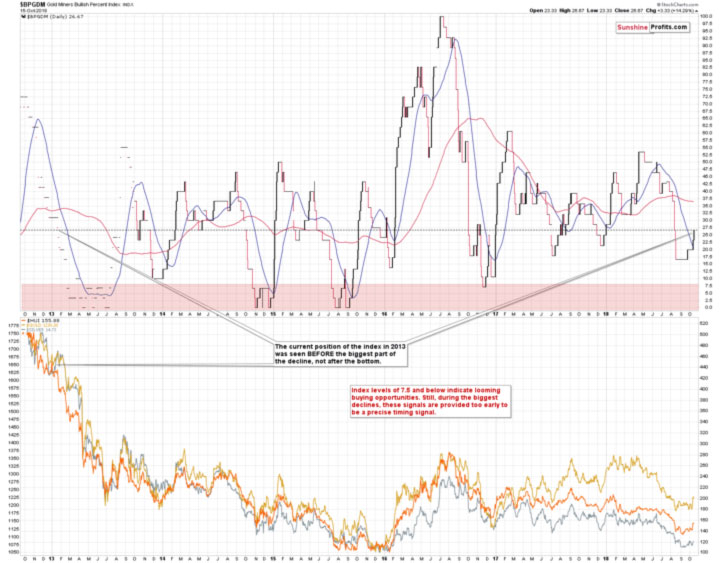
Determining the Outlook for Mining Stocks? Look Deeper Than OthersPrzemyslaw Radomski Gold miners completed the inverse head-and-shoulders pattern – it’s now a fact. And many analysts would have one believe that it’s the only fact that matters right now or that it’s of major importance. But just like focusing on one tree can make one miss the entire forest behind it, the above could make the entire precious metals outlook appear different than it really is. There are multiple factors in place and we will not cover all of them in this essay, but even in case of the mining stocks, there are many factors that gold promoters and those who put a lot of weight in the inverse H&S pattern in mining stocks, are usually not mentioning in their analyses. We’ll discuss some of those factors below. Let’s start with the long-term chart featuring gold stocks’ proxy – the HUI Index (charts courtesy of http://stockcharts.com). Broad Perspective – Big Implications (Click on images to enlarge) From the long-term point of view, we see that the gold miners have not moved above the 2016 lows, which means that the current situation remains similar to what we saw in April 2013 before the decline. Back then the corrective upswing was smaller, but it also took miners higher, yet not to the previous major bottom, let alone above it. Based on Monday’s reversal, it seems that the next short-term move will be lower. This, in turn, means that the very bearish link to 2013 is likely to be preserved and the very bearish implications for the following weeks will remain in place. When looking at miners’ performance relative to the general stock market we also see bearish indications from both: short- and long-term point of view: Gold Stocks vs. Other Stocks From the long-term point of view, we see that the ratio between gold stocks and other stocks (S&P 500) moved to the declining resistance line, which is a good reason for a reversal. On the short-term chart, we see that the rally was so sharp that it triggered one of the most reliable sell signs (6 out of 7 signals in the past few years were followed by substantially lower gold prices). The sell sign is flashed when the RSI based on the ratio moves visibly above the level of 70. That’s what we just saw. We received a couple of interesting questions and it seems that our replies might be useful also to you. Some of them are about the outlook for the entire precious metals sector, while the others are specifically for the mining stocks and the Gold Miners Bullish Percent Index. One of the questions was if the current decline in the stock market is going to be as significant as it was in 2008 and if it’s going to drag gold lower as it did in 2008. In our view, it’s possible, but not very likely. Back in 2008, there was a liquidity crisis and practically all assets declined due to it. The situation is not similar to what happened then – there is no liquidity crisis. But, gold is likely to decline in the following weeks anyway due to other reasons and the current spike in stock market’s volatility is one of the bearish confirmations. In other words, things don’t have to be as bad for the stock market for gold to decline. In fact, they don’t have to be bad at all for gold to decline, but the VIX signal that you can see below makes a decline more likely. Gold vs. Stock Market Volatility The spike in VIX, the volatility index, is something that in the vast majority of cases (8 out of 10 since the 2011 top) meant excellent shorting opportunities in gold. We previously reported 7 out of 9 efficiency, as we counted the two previous 2018 spikes as one. It seems that the tops were far apart by enough days for them to count as separate cases. What does the above imply for the gold market right now? That it’s likely to decline and that it’s likely to decline significantly. That’s right – what we’re seeing in the general stock market is not a bullish factor for gold, but a bearish one and the above charts clearly shows it. The Boomerang CoT & Inverse H&S Questions Another question was about the situation in the CoT reports and if it’s likely to trigger a rally here. We already commented on these reports usefulness in the past and nothing changed in that regard, so instead of replying once again, we will invite you to read our previous analysis of CoT’s usefulness and problems related to it. There was also a question about the possibility of seeing an inverse head-and-shoulders in gold in a long-term basis. It’s one of the boomerang questions that we get asked on regular basis (the same goes for the CoT questions). Just like the CoT question, it was already replied to earlier. You can read the full analysis here, but the long-story-short version is that the pattern is very far from being completed and as such has no implications at this time. It simply doesn’t exist. Gold to Rally NOW Based on Fundamentals? We were asked if gold is starting a major rally due to the trade wars, and other fundamental factors. And our reply is that despite the very short-term price moves, the fundamentals are unlikely to determine the market’s short-term and – to some extent – medium-term trend. They can tell that the market is going to rally in the following years (!), but they don’t say much about the next few months. Are fundamentals positive? We agree – it means that gold can soar in the coming years, and it can just as well rally and decline in the next few months. The technical, cyclical and other analogous factors can be applied to determine where a given market (here: gold) is likely to move in the next several weeks and months. Fundamental details are not likely to indicated the above. Gold Miners Bullish Percent Index – Context is King Finally, we were asked if the current reading (26.67) in the Gold Miners’ Bullish Percent Index is a bullish factor. It’s not. As a reminder, the Gold Miners Bullish Percent Index ($BPGDM) is a gauge of overbought and oversold conditions for the gold mining sector. It is a breadth indicator based on the number of stocks with Point & Figure buy signals (a Point & Figure chart emphasizes strong moves while ignoring small ones) within this index. You can see the last several years of its performance below. To be precise, the current reading is more or less in the middle (median) of the trading range. The only exception that we saw was in the first half of 2016. The index moved a bit higher recently, but it didn’t start the rally from very oversold levels. The current move so far seems similar to what we saw in October and November 2016, before the sizable decline and in the final part of the corrective upswing. Is any of the above bullish? Not really. Yes, the index is closer to being oversold than to being overbought, but that’s not an indication of a bottom. In fact, in 2013 when we saw similar values of the Gold Miners Bullish Percent Index, the real decline was only starting. Given the similarities to what happened 5.5 years ago, should the current value of the index be viewed as something bullish or an indication that the bottom is in? Definitely not. Some may even say that it’s a bearish indication, because the true bottom was so much lower in 2013. In fact, the final bottom was not even in, when the index moved to 0 for the first time. Consequently, if this is THE final decline in the precious metals sector, it might be best to view the Gold Miners Bullish Percent Index and it’s 0 reading as a “bottom is near” sign instead of viewing it as a sign that says “the bottom is definitely in”. Summary Summing up, the breakout in gold and mining stocks was a bullish development for the short-term, but the rally that was likely to be seen based on it, could have already taken place. This is especially the case given the shape of Monday’s session in mining stocks – a clear reversal. As indicated earlier, there are many more factors that are currently in play and that we describe to our subscribers and the outlook is not as bullish as it may seem at the first sight. Even in case of the mining stocks there are many bearish factors that are currently in play – it’s not only the inverse head-and-shoulders that should be paid attention to. Thank you. ### Oct 17, 2018 Disclaimer: All essays, research and information found above represent analyses and opinions of Mr. Radomski and Sunshine Profits' associates only. As such, it may prove wrong and be a subject to change without notice. Opinions and analyses were based on data available to authors of respective essays at the time of writing. Although the information provided above is based on careful research and sources that are believed to be accurate, Mr. Radomski and his associates do not guarantee the accuracy or thoroughness of the data or information reported. The opinions published above belong to Mr. Radomski or respective associates and are neither an offer nor a recommendation to purchase or sell securities. Mr. Radomski is not a Registered Securities Advisor. Mr. Radomski does not recommend services, products, business or investment in any company mentioned in any of his essays or reports. Materials published above have been prepared for your private use and their sole purpose is to educate readers about various investments. By reading Mr. Radomski's essays or reports you fully agree that he will not be held responsible or liable for any decisions you make regarding any information provided in these essays or reports. Investing, trading and speculation in any financial markets may involve high risk of loss. We strongly advise that you consult a certified investment advisor and we encourage you to do your own research before making any investment decision. Mr. Radomski, Sunshine Profits' employees and affiliates as well as members of their families may have a short or long position in any securities, including those mentioned in any of the reports or essays, and may make additional purchases and/or sales of those securities without notice. 321gold Ltd |