| |||
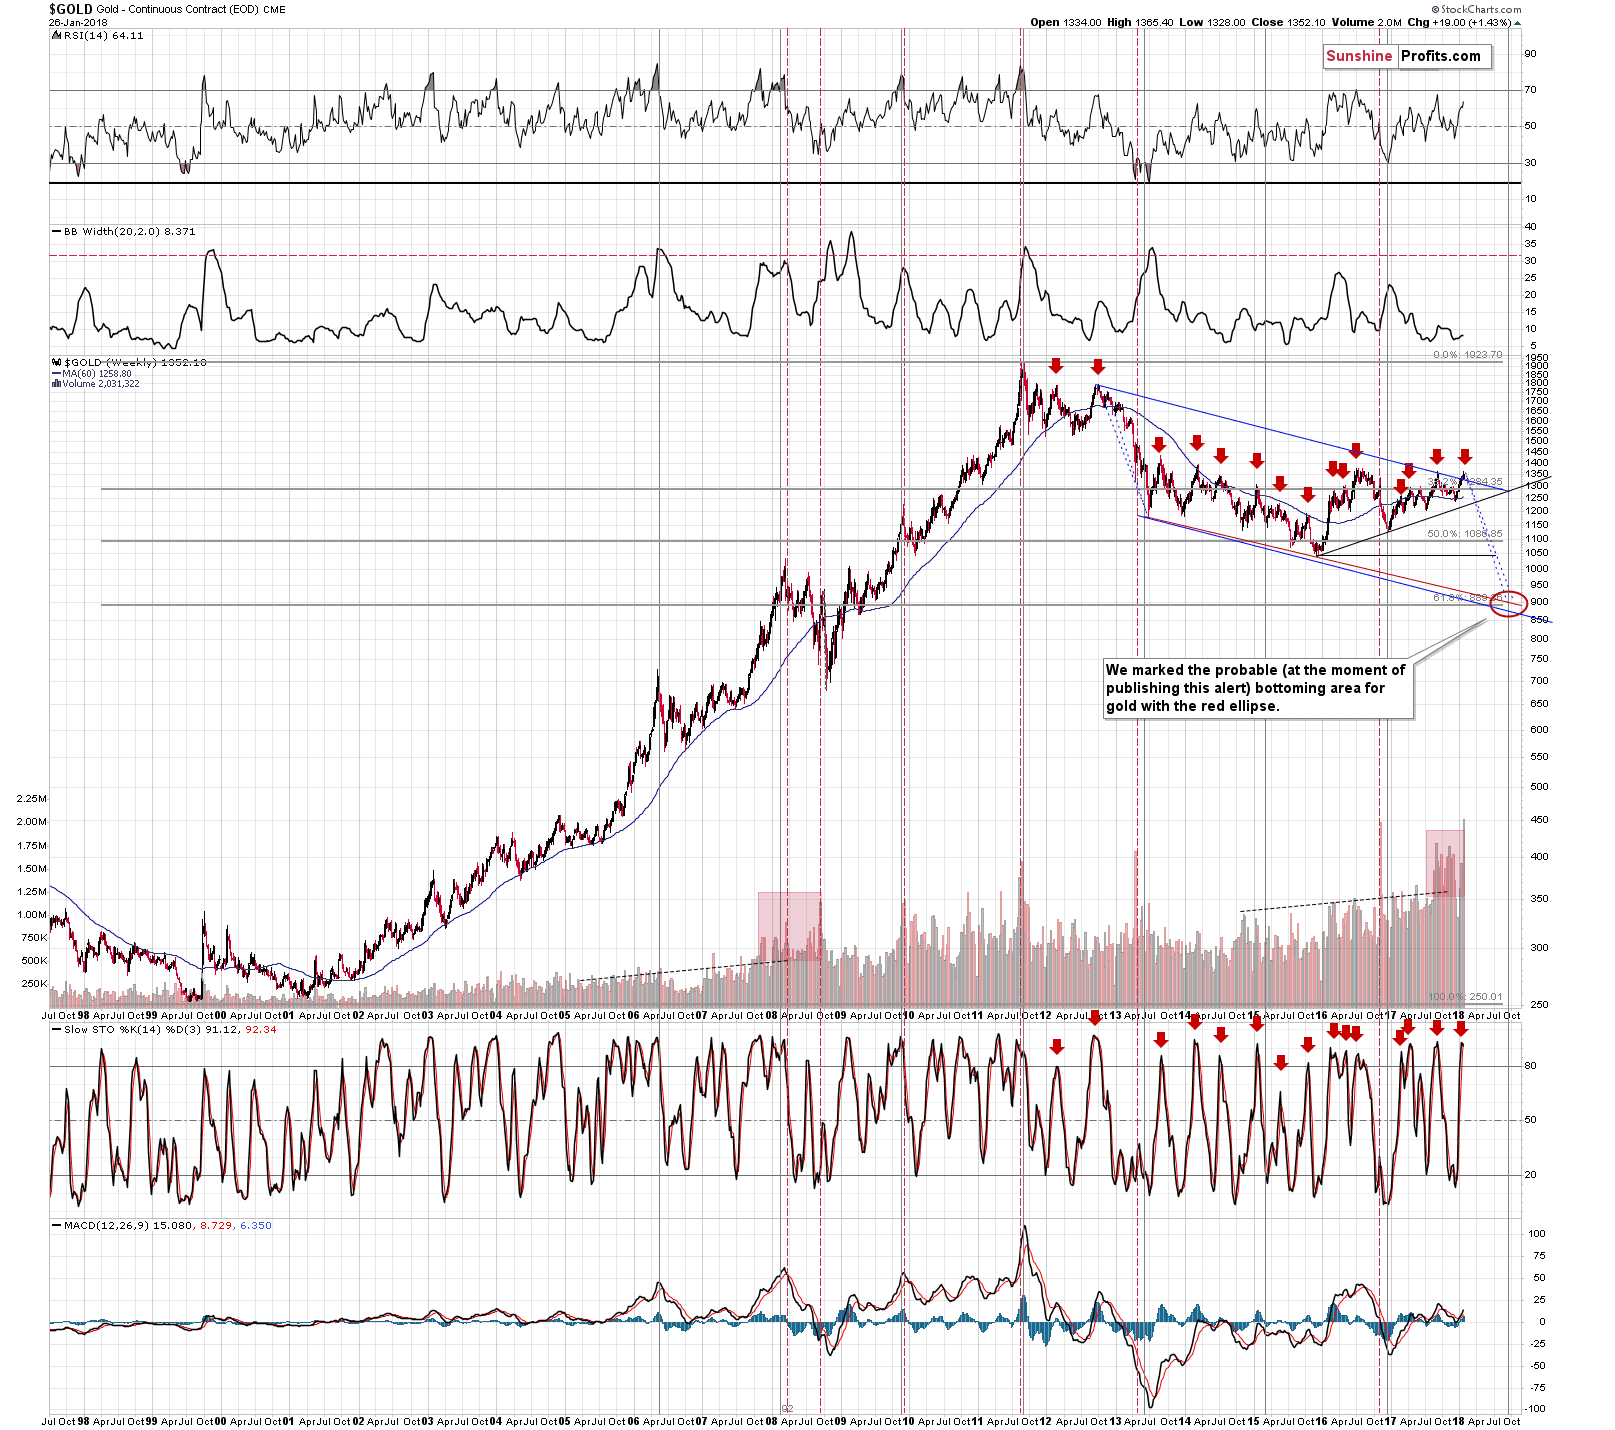
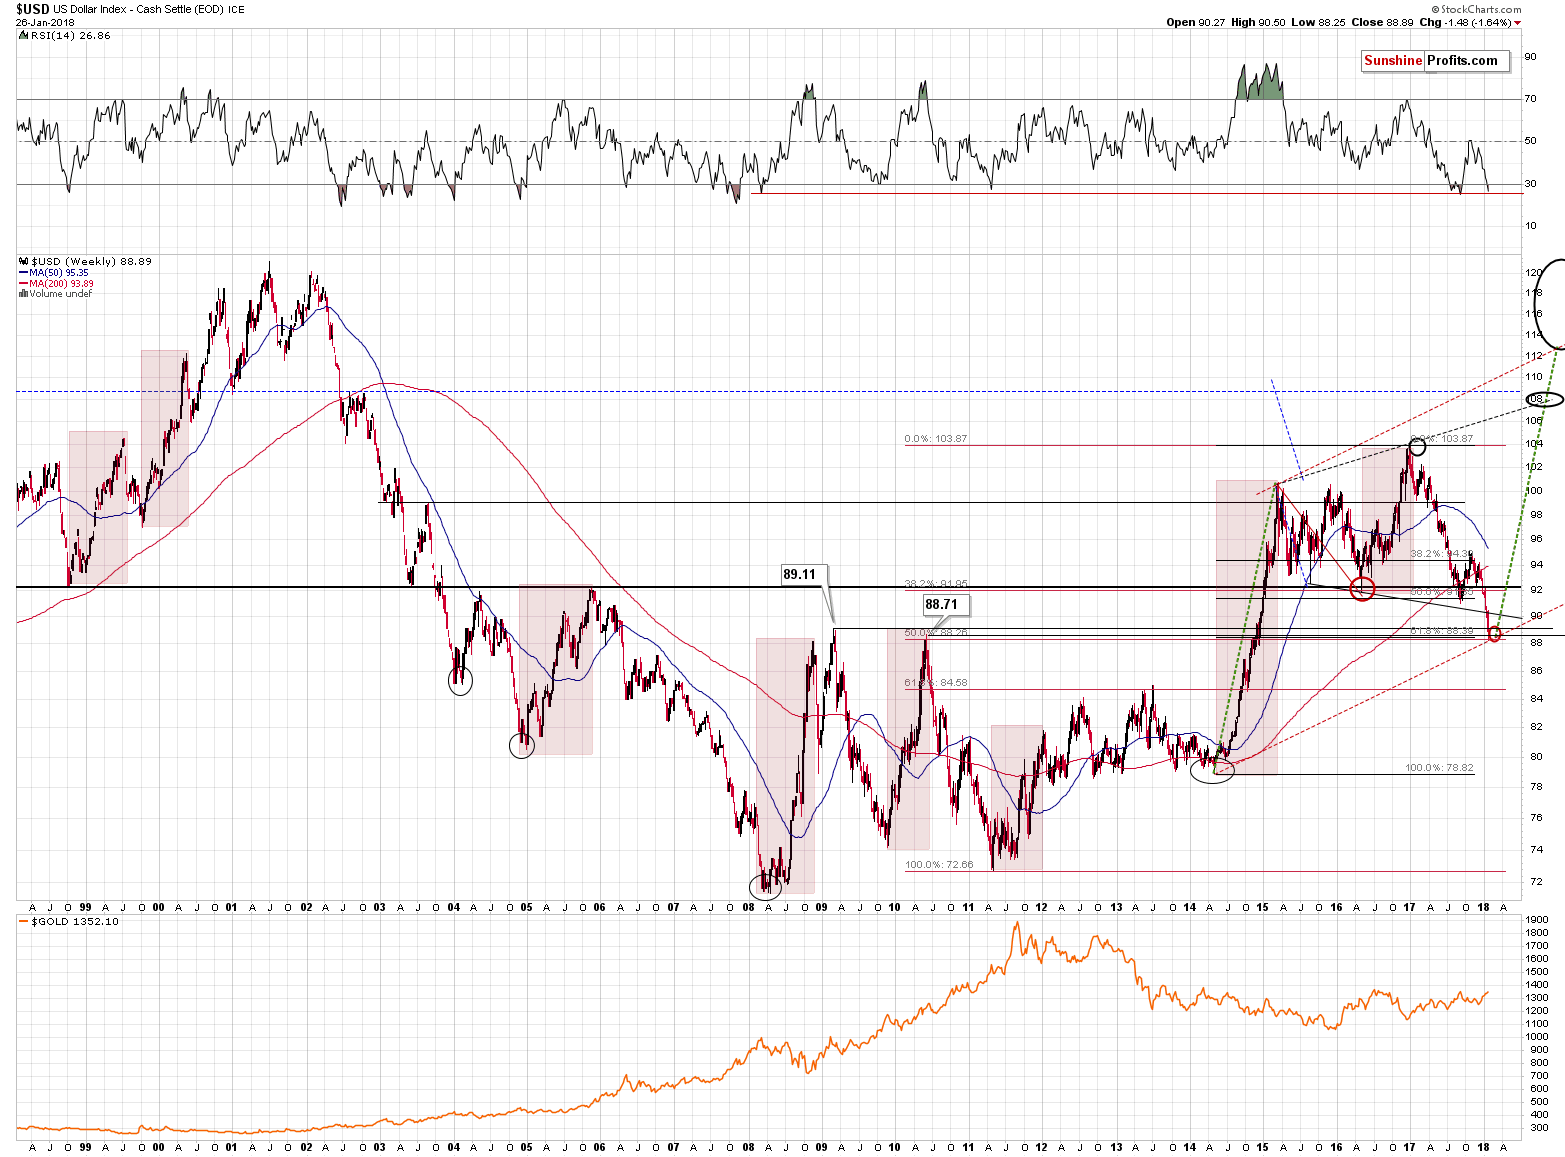
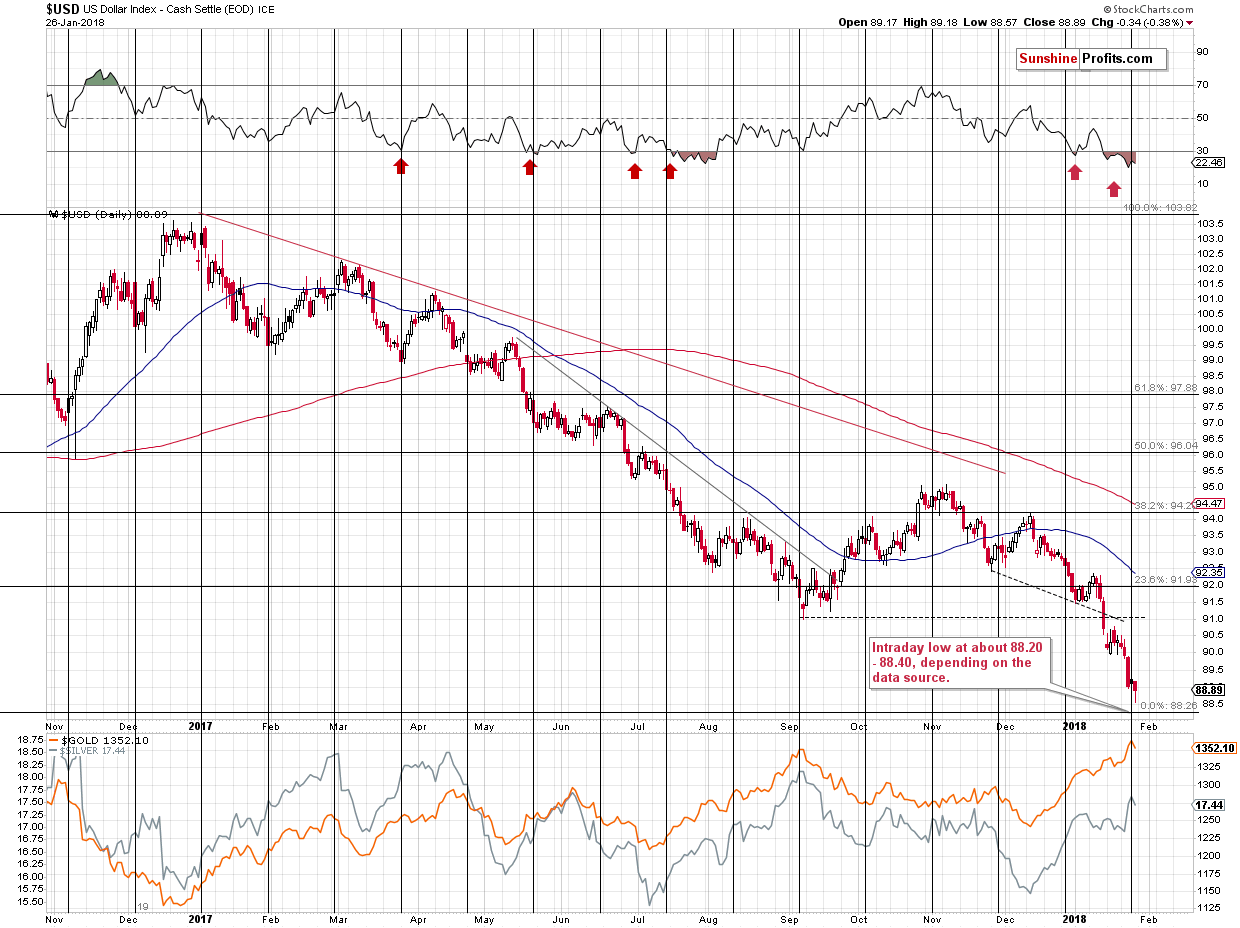
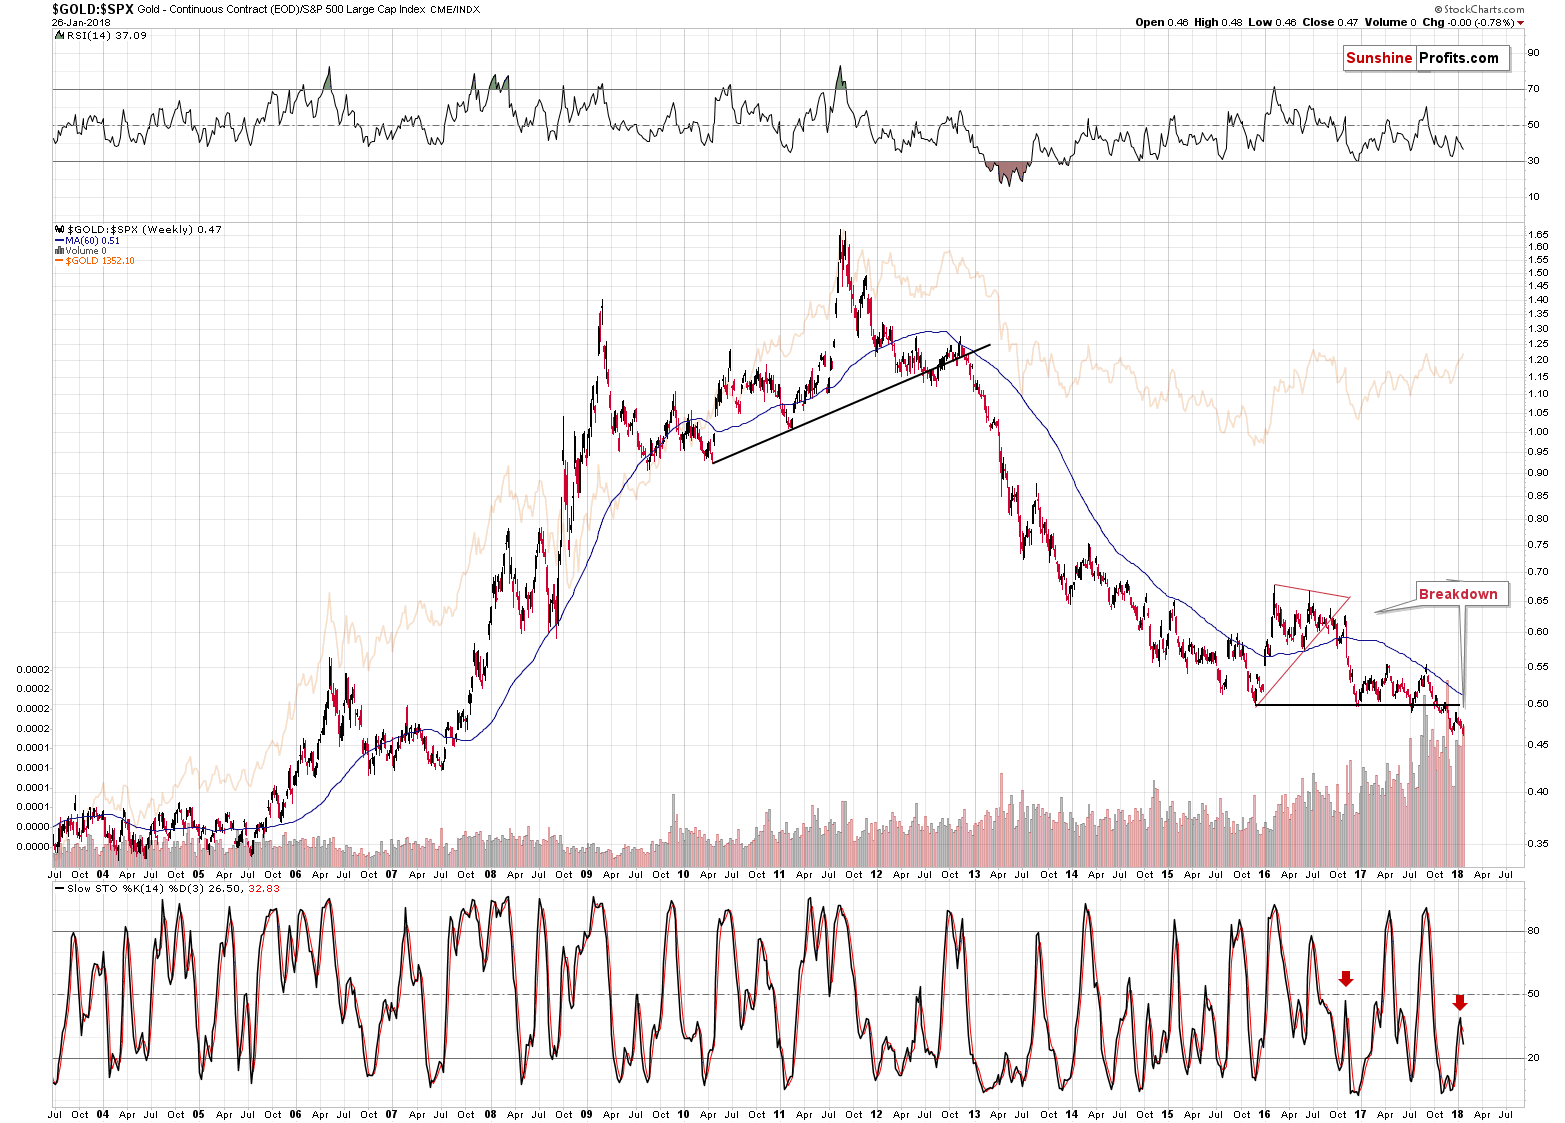
THE Week. THE Record. THE Extreme Sign for GoldPrzemyslaw Radomski To say that gold’s weekly volume was big is like to say that snails are not the fastest animal. You can't say that it’s a lie, but it doesn't really convey the entire truth, either. Gold’s weekly volume was the highest EVER. Yes, ever. There was not a single week – not even during the 2011 top or when gold declined in 2008 – when gold moved on volume that was higher than what we saw last week. Is this significant? You bet! The chart below provides details (charts courtesy of http://stockcharts.com). Breaking of the record is important, but it’s just an exclamation mark behind the implications that apply based on the analogy to other huge-volume weeks. We marked situations with extreme weekly volume using vertical red dashed lines. There were 2 in 2008, one in 2009, one in 2011 (THE top), one in 2013, and one in 2016. All of them were followed by declines and 5 out of 6 confirmed a major top. The remaining case was during the 2013 decline. Based on the above analogy, since we are definitely not in the middle of a short-term decline right now, it seems very likely that we are at a major top. The above-mentioned exclamation mark means that the top is indeed meaningful. What could be meaningful about yet another $1,350-or-so top? There were quite a few of them in the past few years. It might be meaningful because that’s the top that starts the final slide in gold. That’s exactly what many other factors are pointing to, so such a scenario seems quite realistic. Having discussed the key gold chart for the key precious metals, let’s check what’s happening in the currency market. We explained the situation in detail and we provided updates during the previous week, so if you haven’t had the chance to read the last few alerts, it might be a good idea to do so today. Since we now have the weekly closing prices, it’s time for a weekly update. The USD Crisis The USD Index closed slightly below the highest of the key support lines (2009 high of 89.11) and above 3 remaining support levels (the 2010 high of 88.71, 50% Fibonacci retracement based on the 2011 – 2017 rally and the 61.8% Fibonacci retracement based on the 2014 – 2017 rally). The additional detail here is that in today’s pre-market trading, the USD Index has already moved to 89.27, which is more above the 2009 high than Friday’s close was below it. In other words, the tiny breakdown was already invalidated. What does this tell us? It tells us that the USD Index is highly likely right after a critical bottom. Even if it was just one of the very important levels that would be reached, the situation would already be bullish in light of the very oversold situation in the RSI indicator. But it’s not just one extreme support that was reached, but 4 of them. Based on the daily RSI indicator, the USD Index was most oversold in more than a year and it reversed exactly at the turning point. The oversold status is not yet a sign that the bottom is in, but it makes other signals – such as the ones described above – much more important. The strength of the bullish factors and the amount of them is almost breathtaking. As we discussed earlier, it was the USD weakness that was most likely the factor behind silver’s lack of decline. If the USD Index has just formed a major bottom – and based on the technical reasons that’s more than likely – then we can expect significant weakness in the price of the white metal in the following weeks and months. Yes, we realize that the fundamental picture for silver is favorable, we are aware of the arguments for the silver shortage and the case for the silver manipulation, but all of this doesn’t have to prevent silver from declining in the medium-term. It certainly didn’t in 2008, so even if we combine the bullish fundamentals for silver, it’s technical picture and the situation in the USD Index, we still get the bearish outlook for the medium-term. Let’s take a look at an additional long-term gold chart. Gold vs. Stocks The special thing about the gold to S&P ratio is that it smoothens the price swings and makes it clear what’s really going on. In the case of the price of gold itself, the short-term price swings are more important, and they look just like early parts of bigger moves. In the case of the ratio, however, the small moves are even smaller, and the bigger ones are even bigger. It’s easier to differentiate between them in this way. The flag example is the 2012 breakdown and the early 2013 decline. In the case of gold, it still looked like a consolidation after a rally, but the ratio showed that the rally was over. The latter turned out to be the reality. The ratio is now after a major breakdown and after a corrective upswing that verified it. It now resumed its decline as confirmed by the sell signal from the Stochastic indicator. The significance of the above is much greater than it may appear at the first sight. The reasons are the analogies to the similar cases. The breakdown below a major support line is very important because the only analogous case was the 2012 breakdown. The one that started the huge slide in the precious metals prices. Why is the confirmation so significant? Because we already had fake breakdowns previously that were shortly invalidated. Not this time. This time the implications are fully bearish and confirmed. Speaking of the confirmation and sell signal from the Stochastic indicator – it’s significant, because of the similarity to the action in late 2016. Back then the ratio broke below the triangle pattern and rallied back up. It then topped and continued to slide – and this slide was confirmed by the sell signal from the Stochastic indicator. We’re seeing the same kind of confirmation this time. Just as the price of gold followed the ratio lower, the same appears likely this time. The gold to S&P 500 ratio is now breaking to new lows and this is taking place after the verification of the breakdown below 2015, 2016 and 2017 lows. It’s tough to imagine a more bearish situation for the ratio – and thus for gold – than the above. Before summarizing, we would like to remind you about the critical signal we described on Friday:
Summing up, the USD’s epic turnaround along with gold’s extraordinary weakness relative to the USD’s intraday decline along with multiple bearish confirmations paint a very bearish picture for the precious metals market for the following weeks. The situation was very bearish for PMs based on the above, but the record-breaking weekly volume in gold took the bearishness to a new – even more extreme – level. Before calling us perma-bears, please note that we’re expecting to see gold well above its 2011 high in a few years, likely more than doubling its price. We just don’t think that the key buying opportunity is already behind us and we want to prepare you for taking advantage of it. If you’d like to receive follow-ups to the above analysis, we invite you to sign up to our gold newsletter. You’ll receive our articles for free and if you don’t like them, you can unsubscribe in just a few seconds. Sign up today. Thank you. ### Jan 29, 2018 Disclaimer: All essays, research and information found above represent analyses and opinions of Mr. Radomski and Sunshine Profits' associates only. As such, it may prove wrong and be a subject to change without notice. Opinions and analyses were based on data available to authors of respective essays at the time of writing. Although the information provided above is based on careful research and sources that are believed to be accurate, Mr. Radomski and his associates do not guarantee the accuracy or thoroughness of the data or information reported. The opinions published above belong to Mr. Radomski or respective associates and are neither an offer nor a recommendation to purchase or sell securities. Mr. Radomski is not a Registered Securities Advisor. Mr. Radomski does not recommend services, products, business or investment in any company mentioned in any of his essays or reports. Materials published above have been prepared for your private use and their sole purpose is to educate readers about various investments. By reading Mr. Radomski's essays or reports you fully agree that he will not be held responsible or liable for any decisions you make regarding any information provided in these essays or reports. Investing, trading and speculation in any financial markets may involve high risk of loss. We strongly advise that you consult a certified investment advisor and we encourage you to do your own research before making any investment decision. Mr. Radomski, Sunshine Profits' employees and affiliates as well as members of their families may have a short or long position in any securities, including those mentioned in any of the reports or essays, and may make additional purchases and/or sales of those securities without notice. 321gold Ltd |