 HUI & POG -
Spread vs Ratio HUI & POG -
Spread vs Ratio
PMtrader
November 12, 2004
Before proceeding with an update of the spread analysis, it may
be of academic as well as pragmatic interest to answer the implicit
question posed by the title to this paper. What is the fundamental
difference between a spread and a ratio analysis?
Pleasingly - if perhaps surprisingly
- the answer is simple. There is no fundamental difference.
Below are listed three examples of spread analysis, and a recent
example of ratio analysis.
Spread:
The
HUI Spread - So far, So good - Oct 4, 2004
The
HUI Spread - An Update - Sep 6, 2004
The
HUI Spread in the Golden Bull - May 3, 2004
Ratio:
Trading the
HUI/Gold Ratio by Adam Hamilton
So, why are these analyses effectively the same? Simple ... given
two series represented by A and B, let's look at the two resulting
series A-B and A/B. A little scrutiny reveals that the negative
numbers in the difference (meaning B > A) map monotonically
to the open interval (0,1). Similarly the positive numbers (meaning
A > B) map monotonically to the open interval (1,infinity).
{Of course A=B implies A-B=0, and A/B=1} Thus, the two methods
are equivalent, and related by a simple transform.
In the specific case of the HUI analysis, B-A (as opposed to
A-B) is compared to A/B, but an obvious and related equivalence
applies. For the HUI, the spread seems preferable in that the
linear trend line introduced in prior papers, and again shown
below, would be aberrantly transformed in ratio space. On the
other hand, ratios have become directly available from online
plotting packages, making them more easily computed. Further,
depending on the relative values of the series A and B, either
a ratio or difference may be a preferable norm, as regards clarity
of presentation.
Armed with how spread and ratio
analyses compare, let's move on to the data presented below.
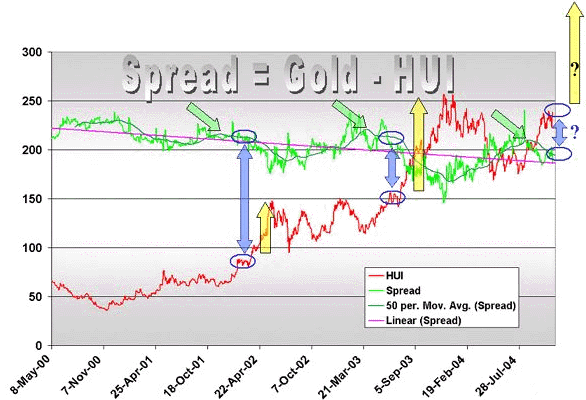
As in the most recent paper on the spread listed above, two primary
sets of daily data are given: the HUI, and the Spread. The spot
gold price has been removed from the plot, so as to better highlight
the fundamental relationships being discussed. In addition to
the primary data sets, the 50 dma (shown as a dark green line)
and the linear trend line (the purple line) for the Spread are
given.

First, notice the blue circles
- connected by the blue arrows. They highlight a flat region
in both the 50 dma for the spread and the HUI index, and they
appear shortly after buy signals (the green arrows) have been
given. Perhaps more importantly, is the subsequent performance
indicated by the yellow arrows. So far, in this gold bull, these
flat regions have been followed by a short dip, and then a stellar
move to the upside.
Though due deference must again
be given to the laws of probability, the conclusion from the
most recent referenced paper seems to apply. The HUI should
gain between 60 and 120 % over the next 10 to 12 months.
Using an approximate buy point of 200, this implies HUI values
sometime in mid to late 2005 of between 320 and 440. Correspondingly,
the spot price of gold should reach values in the range of $500
to $600 per ounce - using the "rule of 200."
If history is any guide, the overriding conclusion about the
current move in the HUI and POG is straightforward - the
best is yet to come.
November 8, 2004
Terry L. Krohn
PMtrader
email: PMtrader
 A
Personal Note
Jun 2006 A
Personal Note
Jun 2006
Many thanks to readers of Eye of the Pyramid!
Axiom House is running a great special starting June 6 and running
all day June 7. You can check it out at the link below. GATA will
receive a $2 donation for every book purchased by a member.
http://www.axiomhouse.com/offers/bonuspage.htm
Eye of the Pyramid can also be purchased at Amazon.
 About Terry L. Krohn About Terry L. Krohn
Mr. Krohn is a research scientist living in the Washington D.C.
area.
His field of expertise is scattering physics - the analysis of
interactions between electro-magnetic waves and matter.
Copyright
© 2004 by Author - Reproduced with Permission.
321gold
Inc

|