|
|||
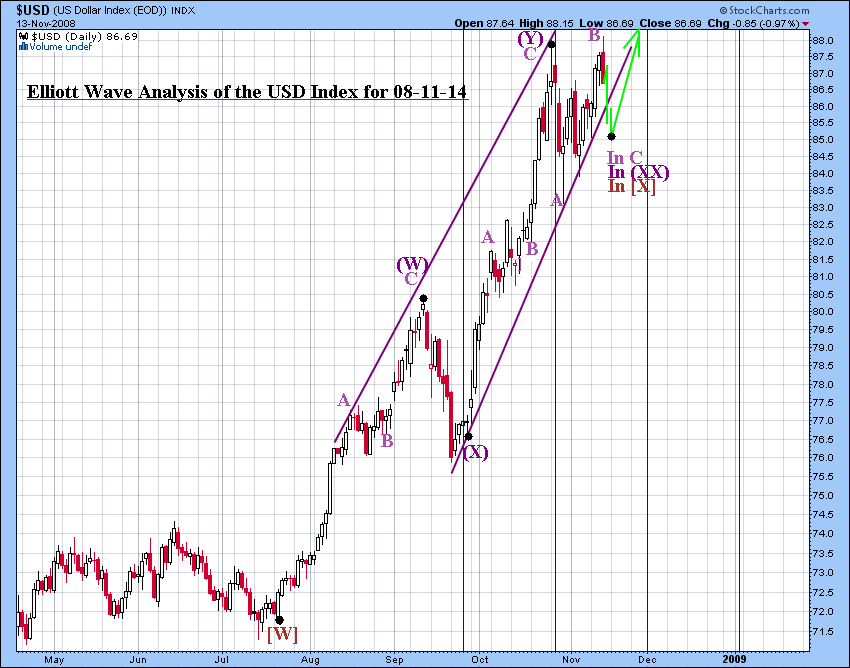
Update of the US Dollar Index, XOI, HUI, CBOE Put/Call RatioDavid Petch I thought it would be better to present a market roundup rather than just the XOI, given the speed with which the market has moved the past few days. Yesterday saw a dramatic move off the lows, which by my judgement is half way through in the mere span of 3 hours. The S&P is likely to go anywhere from 1000-1050 and since the commodity indices (particularly the XOI) have a similar pattern, all should be watched together for indications of a top. The most critical element for all markets is the inverse relationship they have relative to the US Dollar at present. Today, the USD, XOI, HUI and CBOE Equity Put Call Ratio Index are discussed. The mid-term Elliott Wave chart of the USD index is shown below, with a slight modification to the count. I have decided to go with a labeling scheme of the USD as a triple combination, with the present sideways action morphing into a flat instead of a triangle as indicated mid-week. Once this flat structure is over, expect the USD to continue higher with a final target of 95-100... I give some leeway based upon the uncertainty for how the final leg up develops. Everything is trading inverse to the dollar so when the USD tops out, there should be a good bounce in the broad markets... but note there still is a significant down leg quickly approaching before this is possible. The danger with a rising USD is that commodities are going to get squeezed harder, so any chance of a rally in commodities will most likely occur only once the advance in the USD has topped out. Figure 1
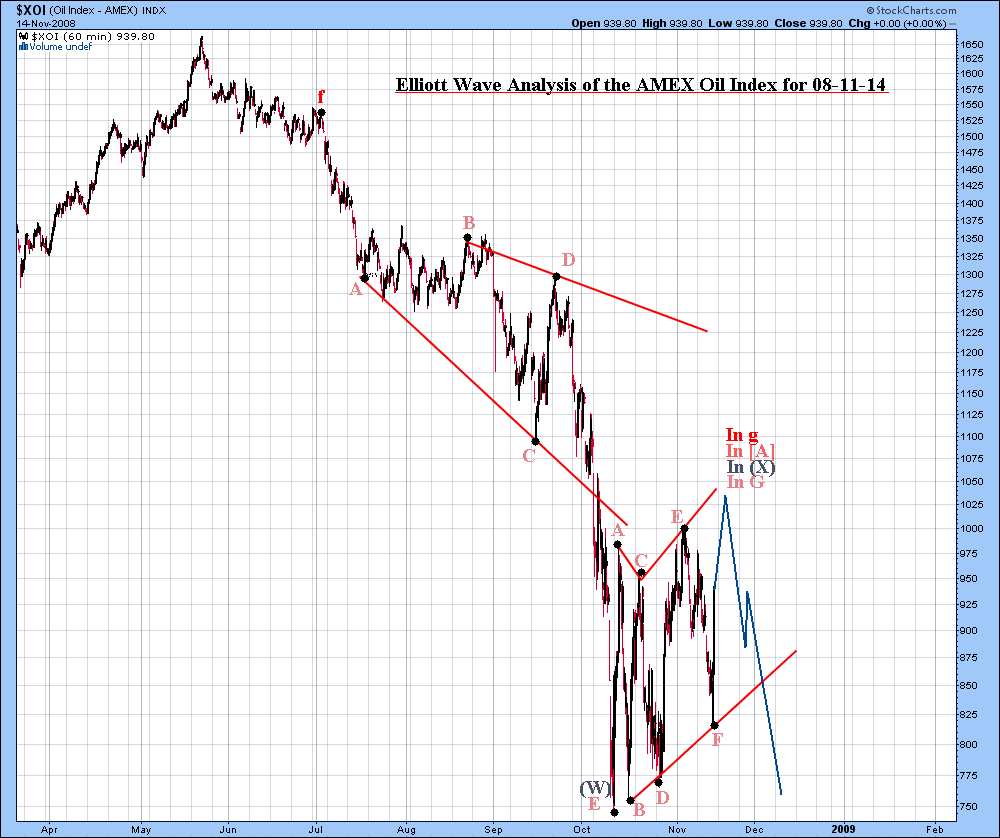
The XOI is shown below, with the thought pattern forming shown in blue. The decline for the XOI was a regular expanding triangle, whereas the S&P was an expanding triangle with reverse alternation. A diametric pattern is developing for the subsequent portion of the pattern, with the present leg nearly "half way done" based upon the expected target of 1000-1025. The XOI is likely going to decline to around 500-550 before bottoming and this should occur no later than the end of March 2009. Figure 2
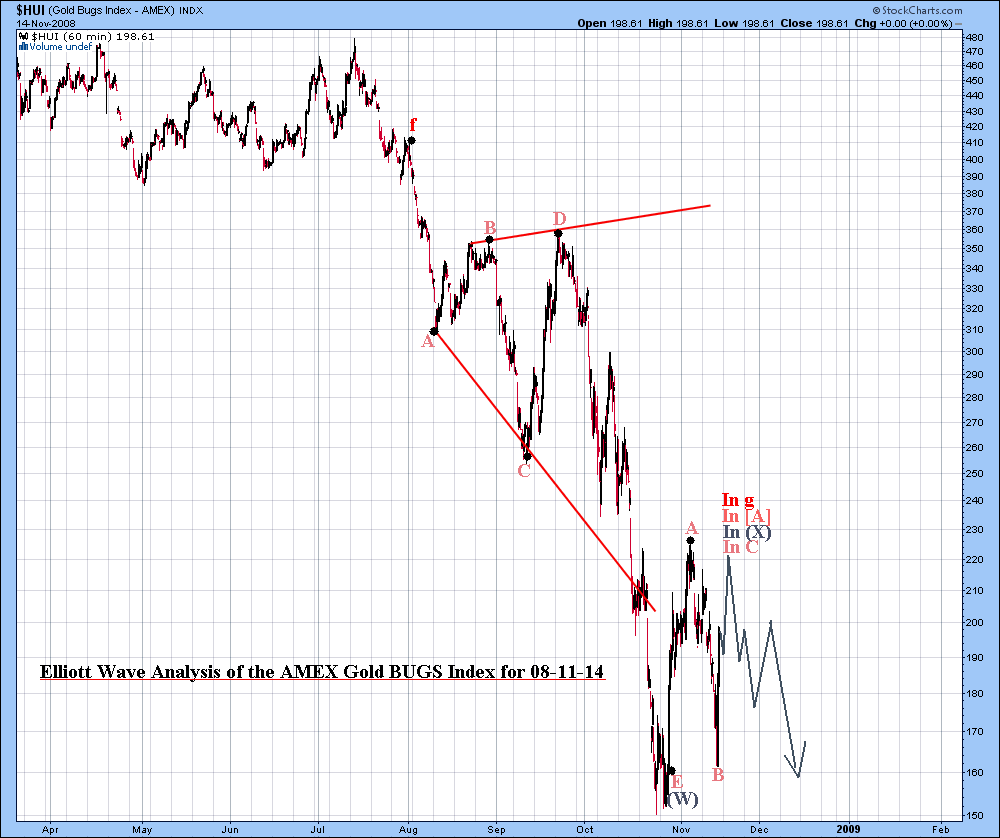
The Elliott Wave chart of the HUI is shown below, with the thought pattern forming shown in blue. The HUI also put in an expanding triangle, but there is no diametric... instead the developing structure is most likely a triangle or a flat. The HUI should bottom around 120 alongside the XOI, S&P etc. The severity of the decline in the coming months is going to be very sharp and lows in all indices could be in place before the end of February 2009. Figure 3
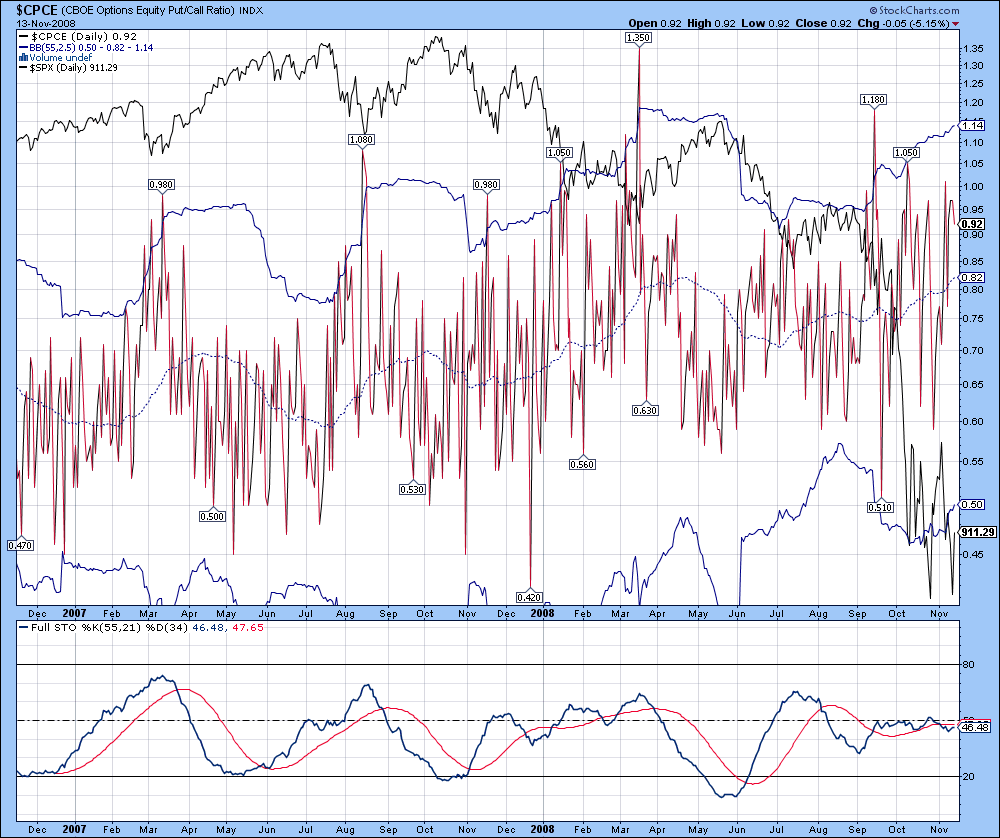
The CBOE Equity Put/Call Ratio Index is shown below, with the S&P 500 Index is shown in the background in black, with accompanying full stochastics shown below. For this chart, the %K above the %D indicates stock market weakness while beneath the %D indicates market strength. The %K is rising to cross above the %D within the zone of a pennant (contraction of the %K and %D since July 2008), suggestive that the upside move is nearing completion, followed by sharp decline after pattern completion. Figure 4
David Petch 321gold Ltd |