|
|||
AMEX Gold BUGS IndexDavid Petch This article was published on Monday July 30th for the benefit of subscribers. Well, the anticipated breakout in the HUI, which was counting impulsive represents yet the third failed breakout attempt over the course of the past 12 months. The only saving grace is that the pressure for an upside move is building and when it occurs, Katie bar the door. Fib price retracements of what was thought to be the "start" of wave III are shown on the right hand side denoted in blue. The 61.8% retracement level has been tested, but short-term stochastics having the %K beneath the %D at mid channel depth suggests further downside/consolidation can be expected. The upper 21 MA BB curled down, confirming the top also noted by the lower BB's curling up. Fibonacci time extensions of various waves are shown mid chart, with the next cluster of Fib dates occurring in early August and early September. Expect the HUI to go sideways for another 1-2 weeks at a minimum before going higher. 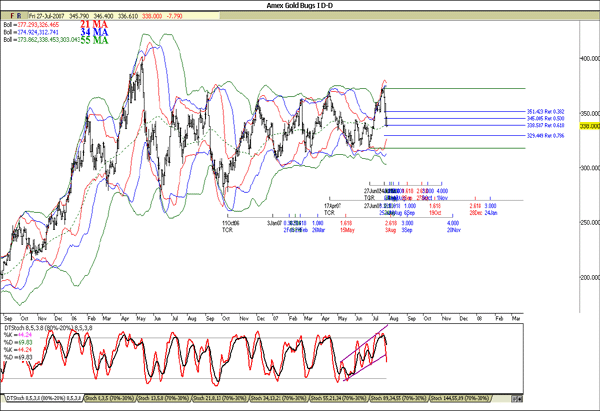 Red lines on the right hand side represent Fibonacci price projections of upward trending wave price action projected off their subsequent lows. Areas of line overlap form Fib clusters, which indicate important support/resistance levels. All the major Fib clusters have been broken, with support at 333. Moving averages are in bullish alignment (50 day MA above the 155 day MA above the 200 day MA), with the 155 day MA acting as support at 337.8. Full stochastics have The %K above the %D, but the %K curling down in practically every instance has resulted in the HUI correcting. The expected time frame for the HUI to bottom (unless a sharp reversal occurs mid channel during the decline) is at least 1-2 weeks. There definitely was damage to the case wave III has started, further exacerbating the extremely oversold condition present in the HUI. 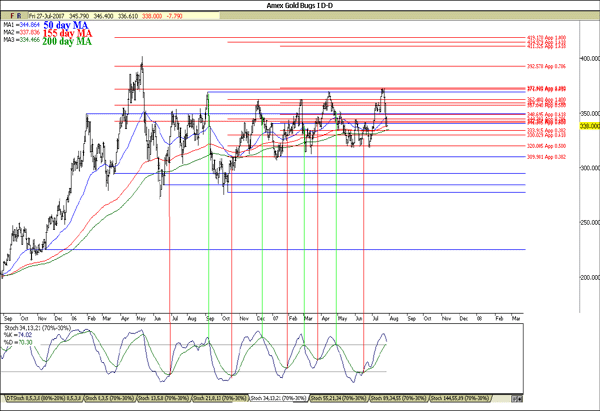 The weekly chart of the HUI is shown below, with Fibonacci time extensions of wave I shown at the top of the chart and Fib price projections of wave I projected off the most recent wave II lows shown on the right hand side (denoted in red). The chart is shown in semi-log format to capture the potential move that lies ahead over the course of the next 4-5 years. My fear is that if the consolidation and oversold condition reaches an extreme, then we could be dealing with the potential of a parabolic move; parabolic moves are really difficult to determine the precise exit point due to the log increase in the slope on a day to day basis near the end of the move. The Bollinger bands continue to consolidate and get tighter. The fact the Babson channel shown below continues to get wider strongly suggests that wave II is a running correction and wave III to follow will be a monumental move to the upside. Full stochastics have the %K above the %D within the confines of a stochastic triangle. The %K appears to have curled down and if so, will remain within stochastic triangle for the next while. 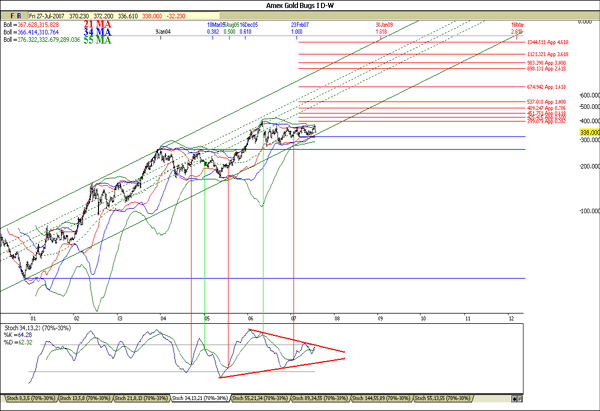 The short-term Elliott Wave chart of the HUI is shown below. Due to the abrupt decline in the HUI, it eliminated the chance wave III started. Notice how I have three identical boxes drawn in place. Three waves of near identical proportions in time at the same Degree can never exist, so this changed things. The HUI pattern now is becoming nearly indecipherable with multiple ways to count, so remember that my depiction is just one of many acceptable versions. The pattern forming is a flat for wave F, with wave v.(c ).[b] forming. The next 1-2 weeks are likely to see a basing, before heading up in wave [c].F. Wave G should take the HUI back down to 330-335. Wave G is likely to finish in September/October, so continue to accumulate gold stocks. 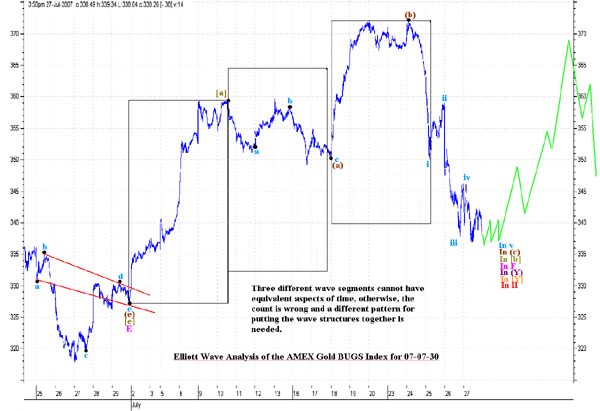 The mid-term Elliott Wave chart of the HUI is shown below, with the thought pattern denoted in green. Wave G could terminate after the next subsequent low (around September) or later if the markets do not cooperate. As the pattern below illustrates, the past 18 months has been a very long and grueling consolidation pattern. The HUI should remain above 320, but expect further consolidation. The pattern as it stands appears incomplete and requires one more leg up to complete wave F before wave G can form. Many junior gold/silver stocks are moving up while the HUI consolidates; this market requires a rifle at present to pick stocks rather than a shotgun approach that works well near the latter part of a long upward trend. Personally, I continue to accumulate gold/silver stocks and view this added "purgatory time" as further opportunity. 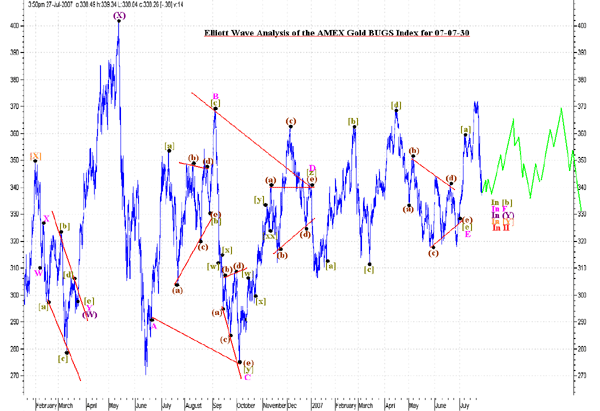 The long-term Elliott Wave chart of the HUI is shown below, with the thought pattern denoted in green. Wave F is still underway, with an expected wave G down to follow, thereby completing wave II. The further sideways action in the HUI is beginning to rule out the possibility that wave [3].III possibility (on log scale charts) and that wave [1].III has yet to commence. The purely corrective nature of the move after wave I implies that wave II (which will have a termination point well above wave I) is a running correction. Running corrections always precede the move that is longest in time, price and complexity, so wave III should hit 1300 at some point in 2009, based upon the technical nature of the charts. 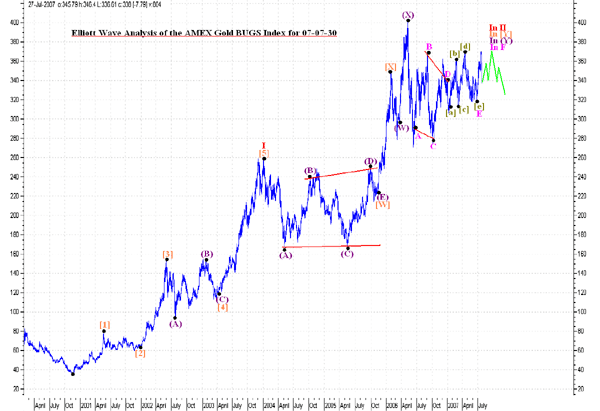 I cover the USD Index, S&P 500 Index, AMEX Gold BUGS Index, AMEX Oil Index and the 10 Year US Treasury Index. Captain Hook, the site proprietor of TreasureChests posts 2-3 times per week with coverage of very important macro issues and how they relate. Also, we currently track some 60 base metal, energy and precious metal stocks. Aug 2, 2007 321gold Ltd |
