|
|||
S&P 500 IndexDavid Petch The S&P 500 Index is experiencing quite the volatility as of late. The upper Bollinger bands are essentially at a point of singularity, so caution must now be exercised. If people have been playing calls since August 2007, we are recommending to at least take 50% of positions off the table. There is a Fibonacci cluster of dates around the end of March, which could see the final area of topping before declining. The purpose of trading the S&P 500 Index is for "swing positions" and to maximize profits, this is our second call for taking profits (first was in November 2006). Could the S&P go higher, yes it will, but given the current setup, some money should be taken off the table. The lower Bollinger bands are in a setup for a decline, which is supported by the short-term stochastics pattern. ST stochastics have the %K above the %D, but it is at a critical juncture that is weighting towards a decline. 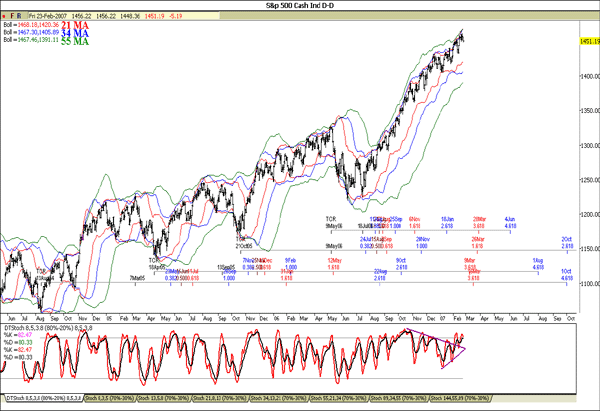 Red lines on the right hand side represent Fibonacci price projections based upon the upward trending wave price action projected off their subsequent lows. The S&P could decline to 1442 before heading higher; expect the unexpected. The positive reversal that occurred from November 2006 until early January 2007 has a measured move to 1472. The S&P could move to this level, but the volatility is only going to get worse. Full stochastics have the %K above the %D, but has been oscillating above and below the %D in an upward rising trend. Moving averages are in bullish alignment (50 day MA above the 155 day MA above the 200 day MA), with the 50 day MA currently acting as support at 1430. The S&P should still test at least the 1500-1550 level, but those with call positions in play for the last 4-6 months may want to take some profit...the volatility could send the price contracts swinging in such a way it will rock your stomach up and down. 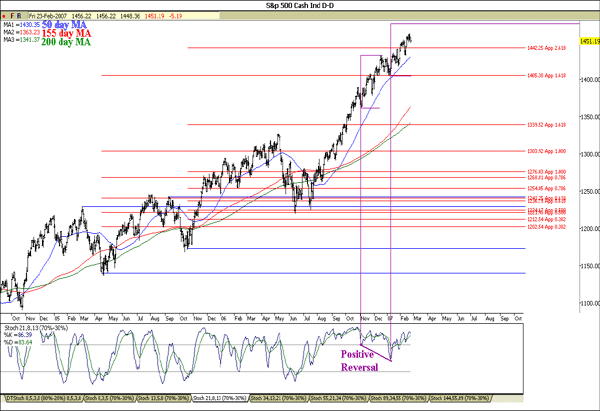 The weekly S&P 500 Index is shown below, with Fibonacci time extensions of the decline shown at the top of the chart and Fib price retracements of the decline shown on the right hand side denoted in red. Notice how the S&P 500 Index has moved in Fib channels since late 2003; every time the S&P has moved through a Fib channel, it has been back tested, prior to moving higher. The upper 21 MA Bollinger band has curled over, suggestive a top is looming in the next 2-4 weeks based upon the upper 34 and 55 MA BB's (they are still rising, suggestive the top is not in place yet, hence a top in 3-4 weeks). The lower 55 week MA Bollinger band is currently at 1171.33, down from last week's value of 1171.48. When a top is put in place, the lower 55 week MA BB should begin to curl up. On that basis, there is no indication that a top is in place yet. Full stochastics have the %K above the %D, with no sign of it rolling over yet. The next Fib time extension point is April 20th. This would represent the longest time point that I could see the S&P rise before a swift correction anywhere from 10-20%. 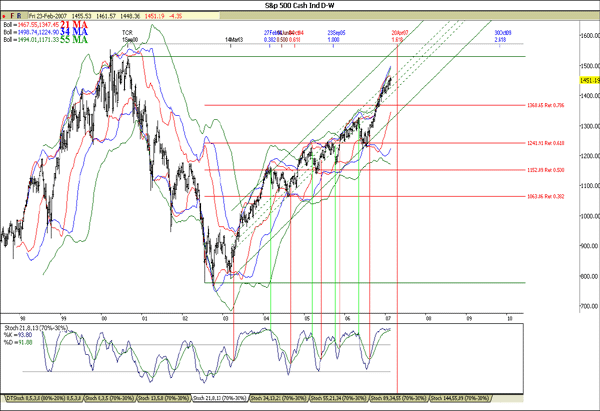 The mid-term Elliott Wave chart of the S&P 500 Index is shown below with the thought path shown below. I think the S&P may decline another 2-4 points Monday AM before continuing on higher (we suggest taking some profits, because if we are wrong in this assessment, at least some profits have been booked. The pattern in this leg up is extremely complex, with the current move up as flat-x wave-?? 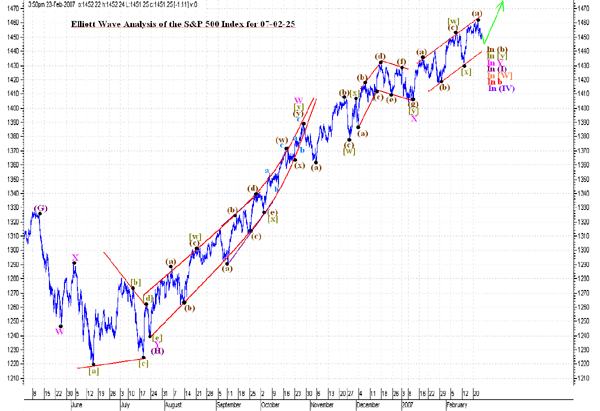 The long-term Elliott Wave chart of the S&P 500 Index is shown below. One count I am leaning towards is that wave (A) is labeled as (W) and everything up to wave (H) is wave (X) in the form of a diametric triangle. I see either as a possibility, but both can not be ruled out. The target is 1500-1550 and it could be hit in the next week or next 3-4 weeks... that is how much volatility I expect to see in the coming weeks. 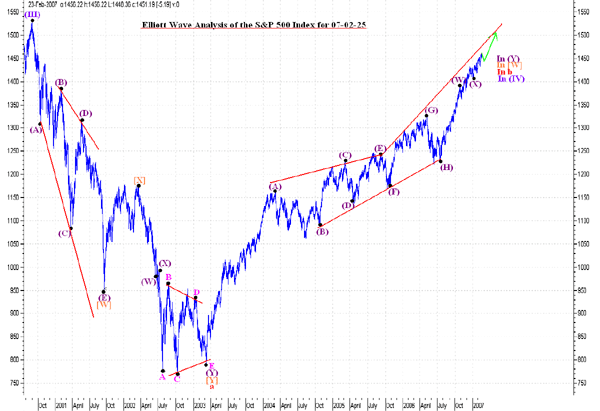 There are a few little brief points I want to make: i) I heard on the net that gold is a hedge against inflation. I think for clarity it should be stated that gold is a hedge against rising interest rates. This would explain what happened in the 1970's and then why gold declined with interest rates from 1980-2000ish (gold broke out before the absolute bottom in interest rates, but followed each other down for nearly two decades). ii) Gold is not a good hedge against deflation initially, because gold, like all other assets will decline as money supply tightens up due to payments made debt payments etc. Gold will decline less than other assets, but in a deflation.... cash is king, plain and simple. After, one will want to be exclusively in gold, because some paper currencies may not even exist. iii) The USD falling will be the final fulfillment in bringing about the terminal thrust of the inflationary cycle. Most commodities are priced in USD and many are slowly starting to be priced in other currencies. When the USD declines, anything the USD imports is going to go up in price. This will cause the price of all commodities to rise because the genie will essentially be out of the bottle. The USD is a reserve currency still, but even if the current level of 65% global holdings declines to 40%, a blow-up of this will automatically cause other currencies to break the inflation genie out of their bottles. As such, the real high levels of interest rates can be expected post 2009/early 2010 once the non-limiting triangle as per the release from last week's piece on the web suggests. iv) The yield curve being inverted in the US no longer carries the relevancy that it once had. The global economies are all linked like at no other point in history. As such the pooled yield curve (average of all major currencies) is more indicative of how the global economies are doing. Consider this... India and China together have some 2.5 billion people compared to the USA having 300 million. If China and India have the overall population having a mere 10% increase in their standard of living would be like another USA coming online. The transition is already underway. Think of the entire required infrastructure India and China are currently developing. This requires copper, tin, lead, nickel etc. and they are all at record shortages. For example, many of the major copper mines of the world are in South America and are slated to close around 2010/2011. Their closures could represent a 10-20% decline in global copper supplies. Fast forward as today, in spite of the fact it appeared prices were heading higher based upon the pattern, my advice last week to take profits on Monday proved to be a good idea. With the inflation cycle being nowhere near complete and the broad markets set to turn higher as per many articles posted on the web, this corrective sequence down represents wave [X].b. For further thoughts on when this leg down completes, with the final wave [Y] initiating, you can visit us at www.treasurechests.info. Feb 25, 2007 321gold |
