|
|||
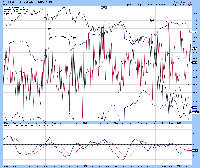
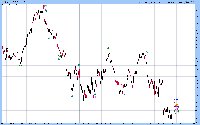
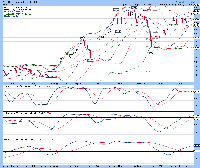
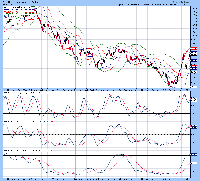
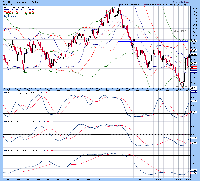
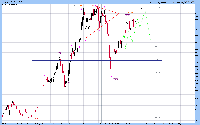
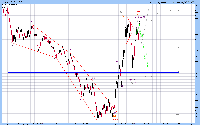
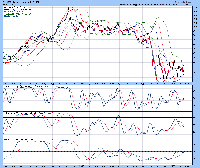
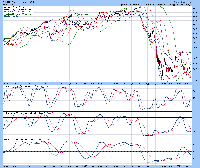
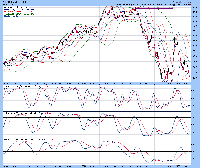
Update of the S&P 500 Index and the US Dollar IndexDavid Petch On Tuesday, the S&P 500 Index swooped below 805 like a hot knife through butter, but a lack of follow through yesterday suggests the alternate count for the S&P 500 Index is now the preferred count. Also in today’s article is an update of the US Dollar Index, along with various currencies. S&P 500 Index The CBOE Options Equity Put/Call Ratio Index is shown below, with the S&P 500 Index in the background and accompanying stochastics shown below. For this chart, the %K above the %D is an indication of general market weakness, while beneath the %D is an indication of general market strength. The %K appears to have hooked up after Tuesday’s sharp decline, suggestive that a crossover for more than 3 days could lead to a change in sentiment. Figure 1 The short-term Elliott Wave count of the S&P 500 Index is shown below, suggestive that wave (c).[b] of a flat pattern is completing, with wave [c] to follow. Based upon time relationships, wave (c).[b] should not complete until February 23rd-24th. Wave [c] should last 3-4 weeks at a minimum before heading higher. There is a way to count the pattern after wave [x].XX as a contracting triangle with reverse alternation, but I will stick with the labeling scheme I have been using. If the scenario I have labeled is correct, then expect a narrow trading range over the course of the next 3-5 trading days before breaking out to the upside. Figure 2 US Dollar Index The daily chart of the US Dollar Index is shown below, with the upper 21 and 34 MA Bollinger bands riding the index, suggestive that further upside should be expected. Full stochastics 1, 2 and 3 are shown below in order of descent, with the %K above the %D in all three instances. Based upon the %K curling back above the %D in #1, expect upside strength to continue into the foreseeable future. Figure 3 The weekly chart of the US Dollar Index is shown below, with upper Bollinger bands above the index and lower BB’s still rising, suggestive further upside should be expected. Full stochastics 1, 2 and 3 are shown below in order of descent, with the %K beneath the %D in stochastics #1 and #2, but above it in #3. The %K in #1 and #2 has curled up, suggestive that upside in the USD could extend for another 3-4 weeks. Figure 4 The monthly chart of the US Dollar Index is shown below, with the index rising above the upper 21 month MA Bollinger band, while all three lower BB’s are between 68.50 and 70.41. The 34 MA BB is above the 55 MA BB, suggestive that the mid-term trend is oversold, further confirming strength in the USD. Full stochastics 1, 2 and 3 are shown below in order of descent, with the %K above the %D in all three instances. Based upon present positioning of the %K in stochastic #2, the USD could remain in an overall uptrend for most of 2009. Figure 5 The mid-term Elliott Wave chart of the US Dollar Index is shown below, with the thought pattern of the USD shown in green (was originally added over one month ago). The USD has nearly mirrored the thought pattern to a tee and has nearly broken above the former high established back in late November 2008. Trends for the USD suggest further upside, which creates uncertainty with respect to whether or not the preferred or alternate count is in play. If the alternate count is in play, the USD index could rise to 95-100 over the course of the coming 6-8 weeks. Figure 6 The long-term Elliott Wave count of the USD index is shown below, with the preferred count shown in colour and the alternate count shown in colour. I am going to modify the thought paths of market direction for both counts later on tonight, but I wanted to illustrate how well the preferred count has been tracking the “thought” market direction. Rather than a decline occurring as shown in this chart, expect further upside for 2-4 weeks at a minimum before any sort of significant change in trend occurs to the downside. Figure 7 The Canadian dollar Index is shown below, with lower Bollinger bands all in close proximity, while upper BB’s are starting to fan out, suggestive a breakout of the consolidation pattern is likely... to the downside. Full stochastics 1, 2 and 3 are shown below in order of descent, with the %K beneath the %D in stochastics 1 and 2, while above the %D in 3. Based upon the present trend, expect at least 2-4 weeks of further weakness in the Canadian dollar. Figure 8 The Australian Dollar Index is shown below, with lower Bollinger bands in close proximity, while upper Bollinger bands are starting to fan out, suggestive a breakout of the recent consolidation pattern is likely... to the downside. Full stochastics 1, 2 and 3 are shown below, with the %K beneath the %D in #2 and #3, while above the %D in #1; however, the %K in stochastic 1 appears to be rolling over, suggestive that weakness in the currency from down under should persist for another 2-4 weeks at a minimum. Figure 9 The Euro Index is shown below, with the index starting to ride the lower Bollinger bands, while the upper Bollinger bands are starting to fan out, suggestive further downside is imminent. Full stochastics 1, 2 and 3 are shown below in order of descent, with the %K beneath the %D in stochastics 2 and 3 , while marginally above the %D in 1; this suggests another 2-3 weeks of further downside/consolidation in the Euro Index before basing. Figure 10 ### Feb 22, 2009 |

