|
|||
Fractal Gold ReportDavid Nichols The single best pattern for trading is the parabolic growth pattern, where prices climb along an arc towards a spectacular blow-off top. 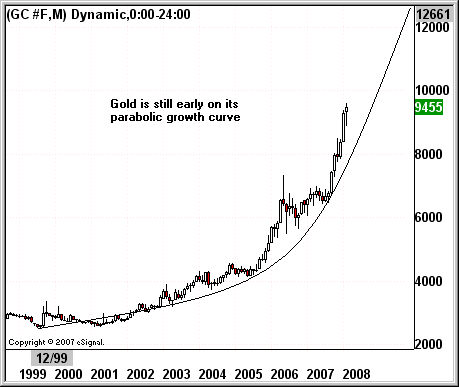 Gold has already been in a parabolic bull market for years, but according to my fractal projections it is still early in the curve. This bull market in gold should last for many more years, and eventually reach heights that very few would dare to predict during these early stages. But there are some tricky things about parabolic growth patterns too. The gains come in sudden one-way moves that are rarely comfortable for trading. Most of the gains come when the market "feels" overbought and ready for a major correction, but prices just keep on moving relentlessly higher. Then when you steel yourself and jump in because "gold is never coming down again", it cycles into a nasty, free-fall correction. Such brutal corrections are also a hallmark of the parabolic growth pattern, as these are necessary to re-energize the market for further gains. You always have to be one-step ahead of a parabolic pattern. If you are, it's the single best market pattern for generating major profits in a short amount of time. In the Fractal Gold Report, I use a unique fractal "tool-kit" to analyze and forecast the bull market in gold. Our latest long entries came at $873 and then again at $903, and while it took some time for these entries to develop into solid winners, we're now sitting on another large profit. There was even one last recommended entry at $916 right as the trend was taking off. 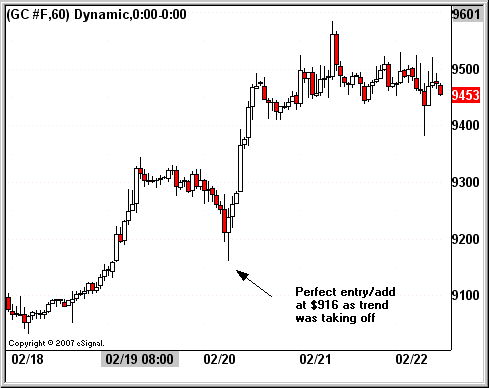 The plan now is to hold on to these long positions as gold climbs up to the major target at $1,010 over the coming weeks. Below you'll find an excerpt from the most recent Fractal Gold Report, discussing some of the things we'll be looking for as gold moves over $1,000. There is the potential for a multi-month top to develop after this push up to $1,000, as the increased attention at the $1,000 plateau could be a classic trap, as fresh money is lured in right before a major correction. Fractal Gold Report for Feb 22, 2008 It was another bullish day for gold, as prices are holding up extremely well following the big move higher over the past two days. 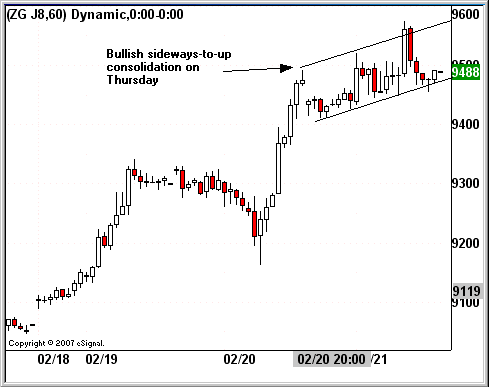 The hourly chart shows Thursday's sideways-to-up consolidation, which is about as bullish as it gets in this context. This implies upside continuation is coming soon following the short-term consolidation. Actually anything other than a nosedive is bullish in this situation, as the main thing we don't want to see right now is a massive drop with no rebound. Gold is notorious for spike tops at major turning points, so we have to always stay aware of that tendency. A closer look at the spike top in May 2006 is helpful in understanding how gold tends to behave at big tops. 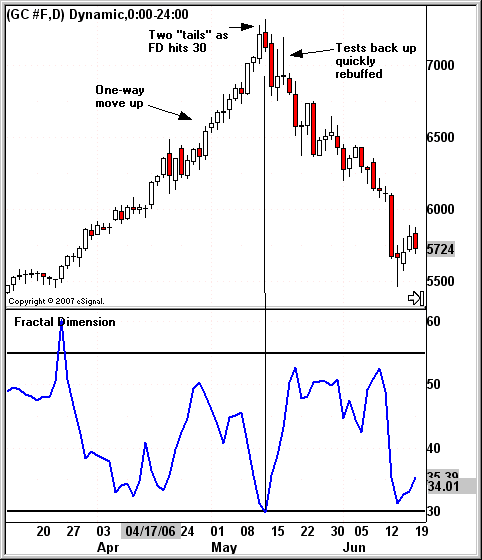 The first thing to look at is the one-way run to the top, a characteristic trait of parabolic growth patterns. It's also important to notice the two small "tails" up on the daily candles, as gold was rebuffed two days in a row as it probed higher. This is especially significant because the daily fractal dimension was down to 30 at the time, indicating trend exhaustion. So we would expect at least a consolidation period to come in at such a point, and the safe play in this situation would be to take profits and step aside gracefully, and not get upset if prices extend a bit further without you. In my experience it's rarely a mistake to take profits when the daily fractal dimension is down at 30. The big red candle that showed up the next day was a big clue that a major, multi-month top was developing. The two candles after this first big red one are also critical for interpreting this as a potential major top. Gold tried on two consecutive days to rally back up to the highs, and was rebuffed both times. During a bullish consolidation period, prices will hover near the highs, just as they are doing now. But when gold is getting ready to enter one of its "free-fall" corrections, there are usually repeated "warning tremors" off the highs, as in this example. Obviously this is harder to interpret in real-time, but the information is usually there if you know what to look for. So we'll use this information to help us figure out how to deal with the big target at $1,010. There is actually plenty of energy available on the daily and weekly charts to support a move right through this target, as the consolidation off the $940 area over the last month has really re-charged the trend, providing a lot of energy for another strong move higher. I think this means we should not be too quick to exit at $1,010, and instead we should watch closely to see how gold is acting around this area. There's a good chance it will overshoot the $1,010 area and extend quickly up to $1,040. But it may not survive for long over $1,000 even if it does first make it up to $1,040. I don't think I'm getting too far ahead of myself discussing these higher targets, as the breakout this week has been very powerful, and the short-term consolidation right now is highly bullish for further gains. We could even see gold ratchet its way up to a minor target at $975 prior to the big push up over $1,000. So it's a good time now to start thinking about potential exit strategies, as gold is poised to continue to rocket higher over the next few weeks David Nichols David Nichols publishes the Fractal Gold Report, a daily report covering the gold market using proprietary techniques that go beyond technical and fundamental analysis. The Fractal Gold Report is available by subscription here. Fractal Gold Report Disclosure. Copyright ©2005-2014 Fractal Gold Report. All Rights Reserved. 321gold Ltd |
