|
|||
Introducing the Gold Currency IndexErik McCurdy What is the true value of gold? When someone asks you what gold is worth, what do you do? Well, if you live in the US, you quote them the current price of gold in US dollars, of course! Below is a daily chart of gold in US dollar terms during the summer of 2005: 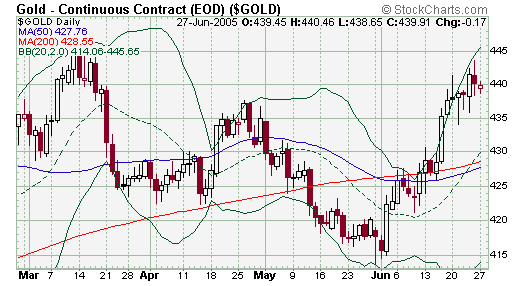 If gold were merely a commodity, focusing on its value in the relative terms of the local currency--or the international currency of choice--might be a perfectly reasonable course of action. However, the precious yellow metal also has the distinction of being, quite literally, hard currency, and when people around the world lose confidence in paper money--as they tend to do whenever the monetary policies of our governments meander off into the realm of fiscal recklessness--gold takes on a life of its own. During those times it is useful to track the intrinsic value of gold, independent of any one particular currency. But how exactly would one do that? The True Value of Gold One way to create a currency independent gold index would be to calculate a weighted summation of its daily price in the currencies of the largest countries in the world (economically speaking, of course). In other words, combine the price of gold in terms of US dollars with the price of gold in terms of euros with the price of gold in terms of the yen, etc., being careful to weigh each country's component according to its share of world GDP. In order to insure index accuracy, enough countries to cover nearly all of the world's total GDP would need to be included. Further, seeing as country GDPs are constantly changing, GDP trends would have to be tracked and country weights adjusted accordingly. The final result would reflect the true international value of gold as a world currency, and look something like this: 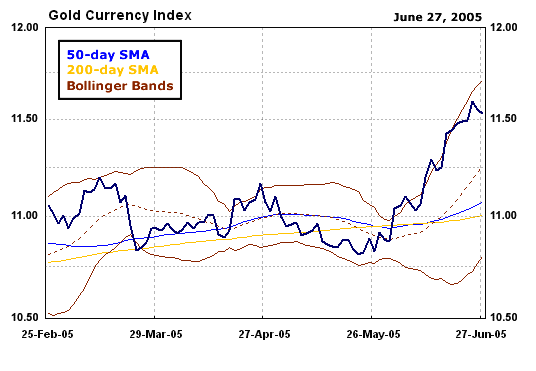 We call this the Gold Currency Index (GCI), and we have been tracking it since the summer of 2005. The GCI provides a number of obvious benefits to anyone who is interested in investing in the precious metals sector. For example, it helps us to more accurately identify the trending characteristics of the developing secular bull market in gold. In other words, it enables us to definitively answer questions such as: When did the secular bull actually begin? What phase is the secular bull currently in? What are the short-term, intermediate-term and long-term outlooks for gold? Further, as useful as it is in examining the aforementioned questions, the GCI provides the most insight when its behavior meaningfully diverges from that of gold prices in other currencies. Take another look at the two charts above. Do you notice anything different about them? In fact, there are some rather striking divergences in their behavior starting in late March. While gold continued down to a new intermediate-term low at the beginning of June, the GCI trended sideways without moving to a new low. Further, when both charts moved sharply higher throughout the month of June, the GCI broke-out to a new intermediate-term high while gold did not! As you know, we chartists place a great deal of importance on divergences between two sets of price data that one would expect to be closely correlated under normal circumstances, and the type of positive divergence displayed above usually carries with it a great deal of predictive weight. This case was no exception, as the GCI break-out of June 2005 began a powerful uptrend that did not end until May 2006 after a gain of 70%! Now that's a useful--not to mention profitable--divergence. Where We Are Right Now Below is the current weekly chart of the GCI: 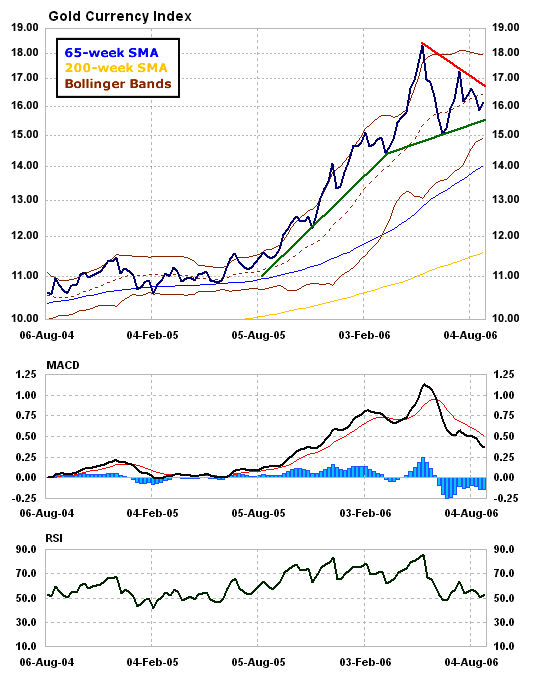 The GCI downtrend from July closed slightly higher this week near the middle of the pennant formation that has been developing since the May high. MACD momentum continued to trend lower in positive territory and RSI continued its second test of resistance at the 50 level. The pennant formation continues to form as expected, and its ultimate resolution via either a break-out or break-down should provide a great deal of clarity in terms of intermediate-term direction. Looking ahead, a successful test of pennant support near 15.50 would reconfirm the formation and forecast a test of resistance near 16.80, while a break below 15.50 would reconfirm the intermediate-term downtrend from May and predict a test of the next support level near 14.80. Both scenarios are equally probable at the moment (50%/50%). Another Tool in the Charting Arsenal We update the GCI at the close of every trading day and provide our statistically based analysis of the daily, weekly and monthly charts in real-time. As we often note, there are no certainties in the financial markets, merely possible scenarios and probabilities thereof. Technical Analysis (TA) provides chartists with an extremely useful set of tools that helps us to identify and profit from the high probability scenarios while managing the risks of the low probability ones. A tracking index such as the GCI is another invaluable charting tool that enables us to stay aligned with--and thus profitably ride--the current secular bull market in gold. Aug 28, 2006 Daily GCI updates are provided at Prometheus Market Insight. 321gold Inc |
