|
|||
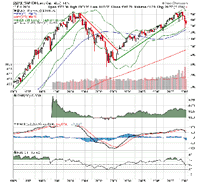
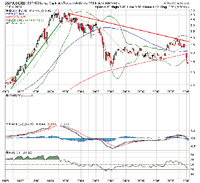
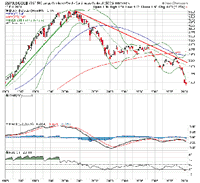
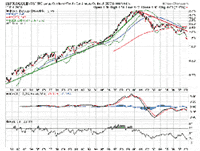
Exposing the Secular BearErik McCurdy The other day a friend asked about my thoughts on the current state of the U.S. stock market, and I began by indicating that we are in the middle stage of a secular bear market that commenced at the beginning of the decade. Immediately I was interrupted and asked what I was talking about, seeing as stocks had just been going "straight up" from early 2003 until the end of last year. So true, I replied, but have we experienced real value growth or have nominal prices merely been floated higher on an ever rising tide of monetary inflation? He didn't understand the distinction, so we embarked on a discussion of the nature of monetary inflation and its impact on global equity markets. Most market participants, and most people in general, have a prohibitively limited understanding of monetary and price inflation. In order to determine whether the stock market is in a bull or bear phase, they simply look at a chart and identify the trend. Let's review the S&P 500 index over the past decade:  So, what do we see here? The secular bull market in general equities that began in the early 1980s ended in 2000. A cyclical bear market then cut the index approximately in half over the next two years, before a cyclical bull returned stocks to those long-term highs last year. As of yesterday, the index is down about 13% from the all-time high. All things considered, things don't look so bad, right? But is that the whole story? As you recall, when stocks went south during that cyclical bear market, the government engaged in an unprecedented campaign of monetary inflation in order to combat potential deflation, reducing interest rates to artificially low levels and pumping historic amounts of liquidity into the system. Thus, in order to evaluate how much real value has been created in the stock market during this decade, we need to somehow strip out the effects inflation. How can we do that? Well, one way would be to create a ratio chart by dividing the S&P 500 index by an index that measures price inflation, such as the CRB index. The long-term chart above is then transformed into a much more accurate measure of true market values:  As you can see, that so-called cyclical bull market from 2003 to 2007 did not create nearly as much real value as the nominal chart would indicate. In fact, from the 2000 peak to the 2007 peak, this chart suggests that stocks actually lost about 29%. Further, as of yesterday, the S&P 500 index is now down about 51% from the secular bull market peak in 2000 in these terms. That is material value destruction that most people know nothing about! And the picture gets even worse if you use other methods to analyze true equity values. For example, some believe that the market price of gold is the most sensitive, accurate measure of inflation. So what happens to our S&P 500 index ratio chart if we replace the CRB index with the price of gold? The answer is, quite simply, very bad things:  In gold terms, the S&P 500 index lost about 64% of its value from the 2000 peak to the "peak" last year, and is now down a total of 74% from the secular bull market high. That, my friends, is a secular bear market in action. Now, some of you may be thinking that inflation has been a constant destroyer of purchasing power since the U.S. Federal Reserve took control of the money supply early in the 20th century, so shouldn't all ratio charts look similarly bleak? Let's find out. Below is a gold ratio chart including the entire secular bull market of the 80s and 90s:  As you can see, the secular bull market did create a great deal of real value over a period of about 20 years, even after the effects of inflation are taken into account. Granted, the above discussion does suffer from some oversimplifications, but these principles are both valid and important. A secular bull market, by its very nature, creates real value and expands multiples, while a secular bear destroys real value, causing multiples to contract. As a market participant, understanding where the stock market is in this perpetual secular cycle of value creation and destruction is vital to achieving long-term investing success. Feb 20, 2008 Erik is a technical analyst and Dow theorist who provides daily chart analysis of the markets at Prometheus Market Insight. |
