Chart In Focus
The Planet Has Something to Say About Inflation Being “Transitory” McClellan Financial Publications, Inc
Posted Dec 22, 2021 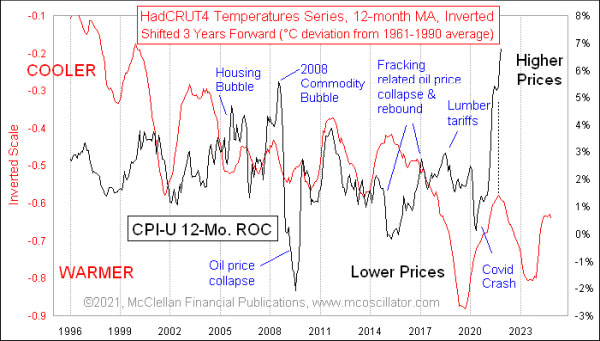
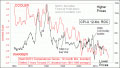
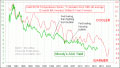
Dec 17, 2021 People think that the Fed controls inflation, and they think that because they were taught to think that while getting expensive educations at institutions of higher learning. And besides, everyone says so, and so it must be true. But what if I could model the movements of inflation rates using no financial or economic data at all as inputs? What would that do to your own personal confidence about the premise of the Fed controlling inflation? This is the quandary I am going to confront you with in this week’s chart, and it is understandably going to make you feel uncomfortable. You are going to have to unlearn a whole bunch of the belief systems that you may have paid a lot of money and spent a lot of time developing. This week’s chart compares global average air temperatures to the Consumer Price Index (CPI) inflation rate. The HadCRUT4 temperature series is published by the Hadley Climate Research Unit at the University of East Anglia in Great Britain, and it factors in temperature readings from over 4000 stations around the world. The CPI is an admittedly imperfect gauge of consumer prices, but it is what we have to work with. The key adjustments in this chart are that the temperature plot has been inverted, and it has been shifted forward by 3 years to better align the two data plots. These adjustments help to reveal how the movements of global average air temperatures tend to show up again later in the movements of the CPI inflation rate. As with a lot of leading indications, the timing of the movements shows up more accurately than the magnitudes, which can get bent by news events or governmental intrusions into the markets. The 2008-2009 exaggerated movements in the CPI growth rate serve as a great example of this principle. A general commodities bubble unfolded in 2008, since stock market investments were not working and the speculators decided to all pile into commodities indexing. As a result, crude oil spiked up to $145/barrel, but then crashed a few months later to $37/barrel. This caused exaggerated movements of the CPI, but the timing of the dance steps still matched the temperature data. And once the oil market settled down, the two plots got back into a nice correlation again for a while. Things got a little bit troublesome in the mid-2010s when the fracking revolution again affected oil prices, and when the U.S. imposed lumber tariffs on Canada that affected the CPI in ways not foretold by the temperatures data. The Covid Crash also was not on the agenda. But as each of these factors passed into the distant past, the correlation returned to being a strong one again. Now we are seeing a 6.8% inflation rate, exaggerated by the effects of Covid business shutdowns and governmental stimulus giving people excess money to spend. But inflation appears to be peaking right on schedule to echo the bottom in temperatures (shown as a top in this inverted scaling) back in late 2018. If the inflation rate continues to match the dance steps of the HadCRUT4 temperature series, then we can reasonably expect the current high inflation rate to moderate. That decline in the inflation rate should last into mid-2023. But “moderating inflation” does not necessarily mean it goes to zero, which is the Fed’s actual statutory mandate. If the Fed could cut the 6.8% inflation rate in half (for example), that would be great, but it would still mean your dollars are losing 3.4% of their value every year. This model can tell us about the timing of the direction changes, but it does not tell us everything about what the Fed might do, or Congress might do, or OPEC might do, that can affect what the actual inflation rate will be. The likely “cause” of why this works is agricultural. Higher temperatures, and rising temperatures, tend to be better for agricultural production. This leads to lower food costs, which trickles through to costs for lots of other things. But even if we cannot identify the root cause for this correlation, we have enough years’ worth of data to demonstrate that it is a real phenomenon, and it is up to us to guess at what the causes may be. Even if we don’t know the cause, we can still make use of the insights. Lest anyone think this is just a spurious correlation in recent years, here is a longer term version of the same chart, using the same inverted plot of temperatures, and the same 3-year time offset. 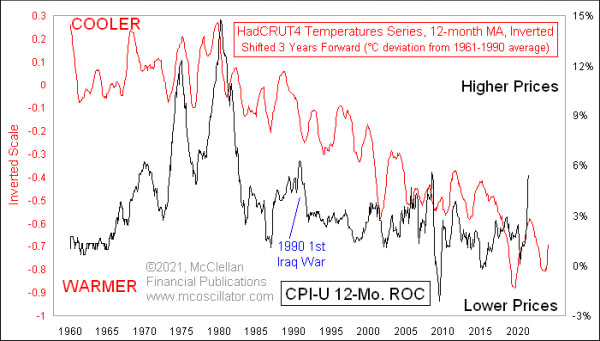
You can see that the correlation is far from perfect, but it is still pretty amazing. The 1990 Persian Gulf War caused oil prices to briefly double, and then collapse back to where they were before, which disrupted the correlation for a few months. But the dance steps are still generally there, and that is the important point to take from this relationship. Temperatures will tell us about the direction of inflation and the timing of the turns. The magnitudes may be affected by other forces. The FOMC members think that they are powerful and can guide the economy and the inflation rate. They have expensive college degrees and hold high-paying positions of great importance, so their readings of the economic tea leaves must be very relevant. Everyone thinks so, and so it must be true. But planet Earth has something to say about the affairs of men, and the pricing of that which we hold dear. *** Related Charts ### Tom McClellan
Editor, The McClellan Market Report
email: tom@mcoscillator.com
website: www.mcoscillator.com
(253) 581-4889 Subscribe to Tom McClellan's free weekly Chart In Focus email. Copyright ©1996-2021, McClellan Financial Publications. All Rights Reserved. 321gold Ltd

|