The McClellan
Market Report
Blowoff Top in Gold an Historic Event
McClellan Financial Publications,
Inc
Posted Dec 16, 2005
In a couple of years, people
are going to be looking back and asking each other, "Do
you remember that big gold blowoff back in '05?" Then they'll
co-opt the line uttered by thousands of Texas oil men, and say,
"Lord, just give me one more of those gold bubbles and I
promise not to screw it up this time."
Our mission at this point,
as analysts and investors, is not to decide whether this is a
blowoff top or not. The market has made that pretty clear in
the past few days. Instead, our mission is to figure out what
this means for the future, and not to get misled by contrary
signs which might pop up to confuse us in the near future.
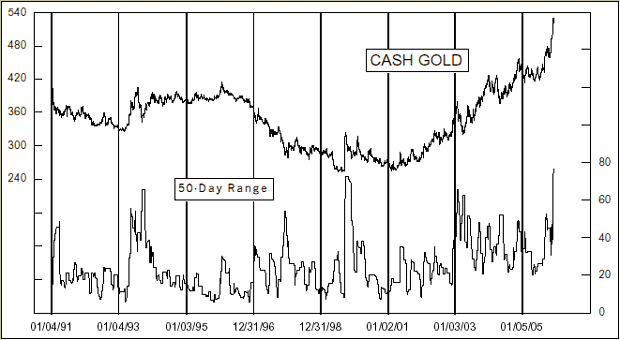
chart 1
The chart above
shows the cash price of gold compared to its 50-day high-low
range. A couple of things are worth noting as we start out. First,
gold tends to make more rounded bottoms, and more spiked tops.
This is the opposite of the stock market, for example, which
tends to have quiet, rounded topping action and panicked, violent
and volatile conditions at bottoms. Second, seeing a big range
over a 50-day period like we have right now is a condition that
reflects that spiky top nature of gold prices. Such high readings
tend to only appear at important price highs.
That chart also allows us to
see that the recent run up from the congestion earlier this year
at around the $420 level dwarfs any of the other price structures
in this 15-year chart history. Clearly, something unusual has
just taken place, and now we get to see the after effects.
The point to understand about
blowoff tops is that once the blowoff is completed, then what
follows is a thorough dismantling of most or all progress that
had been made on the way up. Each of the different blowoff tops
varies somewhat from one to the next, but the common thread among
them is that the slope of the decline after the top is very much
symmetrical to the slope of the advance on the way up.
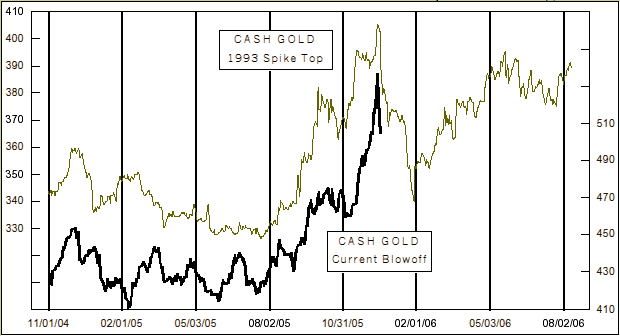
chart 2
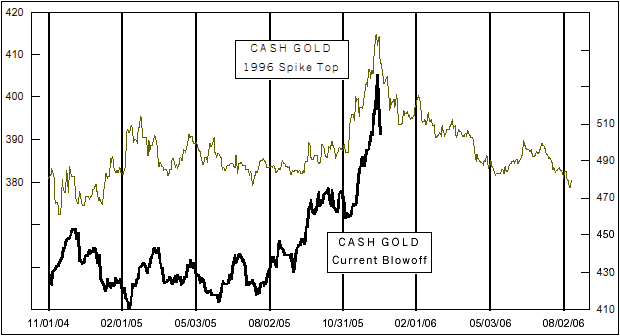
chart 3
Chart #2 compares
the current gold price top to the blowoff top of Aug. 2, 1993.
Chart #3 shows a comparison to the Feb. 5, 1996 top. These comparisons
allow us to see that the chart structures leading up to the blowoff
top were similar to the current structure in both cases. It is
reminiscent of the way that a pole vaulter traces out his steps
beforehand on the runway, so that each time he approaches the
vault the steps are nearly the same.
Most notable is the hesitation
structure which formed during October and early November 2005.
It closely matches a similar choppy sideways structure that formed
in May and June 1993, leading up to that final Aug. 2, 1993 top.
It also resembles another choppy structure which formed December
1995 ahead of the final run up to the February 1996 top in chart
#3.
In each of these cases, the
selloff which followed was very severe. 1993's example saw a
quick downside hit, perhaps too quick because it exhausted all
of the selling pressure in just a couple of months. That selloff
still erased nearly all of the gains that the gold bulls had
needed 5 months to build, and did so in only a two month decline.
The 1996 blowoff top also saw
its rapid drop immediately after the price high, losing about
2/3 of the magnitude of the rally in just 6 weeks, but then proceeding
to give away the rest of it and more over the months that followed.
In that 1996 case, the more gradual selling kept the selling
pressure from washing out all at once, which kept the downtrend
going for longer.
If the 2005-06 instance is
like either of those prior examples, then we can count on a huge
decline between now and mid to late January. We have already
seen a big price drop in just the first two days, but that is
just a down payment. To erase the entire run up to the blowoff
top would mean a return to the $420/oz area. That's not a prediction
or an objective, just a statement of how much more downward movement
is yet to be done to completely erase the run up to the blowoff.
Erasing the run up to the blowoff is the mission of the post
blowoff decline.
Now, if you don't care at all
about gold prices, or gold as an investment, then you have probably
already quit reading this by now. But just in case you are still
hanging on, waiting for the "so what" moment of insight,
then this final chart (#4 below) is what ought to make you care.
It compares the monthly cash price of gold to the 3-month T-Bill
yield. The difference is that we have slid the gold price pattern
forward in this chart by 15 months, in order to show how gold
acts as a leading indication for short term interest rates. Gold
actually serves as a leading indication for inflation, but short
term rates respond to inflation which is what makes this relationship
work.
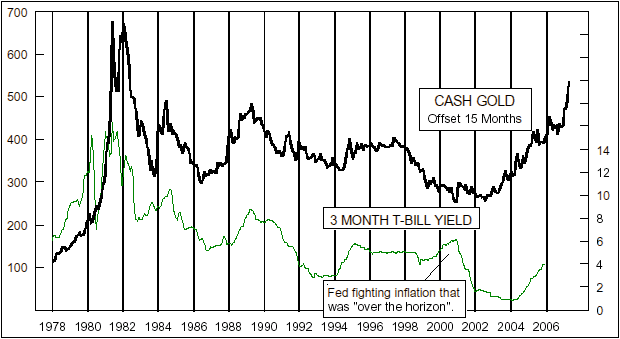
chart 4
The rise in gold prices that
we have just seen has not yet been fully reflected in short term
interest rates. Certain members of the FOMC might think that
they are almost done raising the Fed Funds Rate target, but they
are going to realize in 2006 that inflation pressures compel
them to continue raising short term rates further than they thought.
We may not see the equivalent
magnitude of blowoff in short term rates that we have just seen
in gold prices, but the upward pressure on interest rates should
continue for about the next 15 months. Blowoff tops in 1984 and
1993 saw corresponding rises in short term rates, even though
the gold uptrend was relatively short-lived. The 1996 blowoff
top which we show for comparison above was actually fairly small
in terms of gold price movements, so its effect on interest rates
was much more muted.
The Fed erred in early 2000
by thinking it was smarter than the market, and trying to fight
inflation which was not yet evident but which was thought to
lie "over the horizon". Once they realized their mistake,
they had to overcompensate by drastically cutting rates all the
way down to 1%. Those low rates, and the ponderous rate at which
the Fed has been "removing policy accommodation" have
had the result of creating the tremendous amount of excess money
that has been driving gold prices upward. That excess money will
gradually get converted into price inflation over the next 14
months, to which the short term rates will be rising in response.
Bottom Line: The blowoff top we have just seen
in gold should mark the end of the up move, and now the expectation
is for most of those gains to be erased over the coming weeks
and months. Inflation and rising interest rates will still be
with us for another 15 months, in response to this gold spike.
Resist the temptation to buy gold as a hedge against that coming
inflation, as that opportunity is already passed.
A Special Report
prepared for subscribers to The McClellan Market Report December
14, 2005 ©2005
McClellan Financial Publications,
Inc
email: tom@mcoscillator.com
website: www.mcoscillator.com
You can learn
more about the work of Tom McClellan and Sherman McClellan by
visiting www.mcoscillator.com.
They publish
a twice monthly newsletter, The McClellan Market Report ($195/year),
and a companion Daily Edition ($600/year or $160/quarter). You
can see samples and get information about subscribing by visiting
their website.
©1996-2008,
McClellan Financial Publications, Inc., P.O. Box 39779, Lakewood,
WA 98496-3779. www.mcoscillator.com, tel: 253 581-4889,
800 872-3737, fax: 253 584 8194.
321gold Inc

|
