Chart In Focus
Bumpy Price Oscillator in GDM McClellan Financial Publications, Inc
Posted Nov 19, 2020 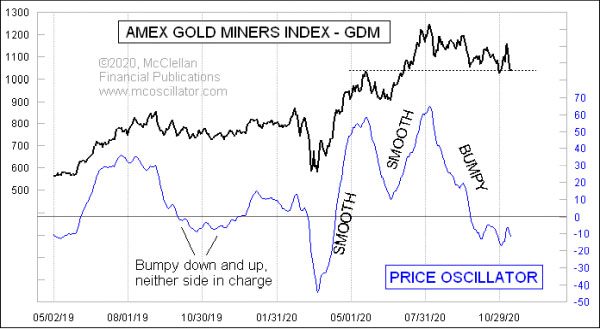
Nov 13, 2020 There is more information in the plot of a McClellan Price Oscillator than just up or down, high or low. Looking at its structures can give us additional information about the strength of a trend. This week’s chart looks at the AMEX Gold Miners Index, GDM. It is showing us things right now which make for a good opportunity for a lesson about Price Oscillator structures. The Price Oscillator for the GDM is falling right now, but there is more information in its chart plot than just up and down. How and when that happens matters. A smooth Price Oscillator move, either upward or downward, carries a message of strength for that direction. A bumpy Price Oscillator move carries the opposite message, saying that even though prices are moving that way, it is not the direction of strength. That is important now because the consolidation since early August has been accompanied by a bumpy down move. Even this latest Price Oscillator downturn which started this week just appears to be a continuation of that bumpy downward move. The bears showing weakness this way does not mean that the bulls have to take charge now, just because we notice it. The bulls may not take charge at all; it is possible for both sides to show weakness. That is what we saw around the 10/30/19 gridline. Bumpy down was followed by bumpy up, and prices really did not go anywhere. So that outcome is a possibility. The GDM is also appearing to be finding support at the level of its May 2020 high. That makes sense, that a bumpy down move showing weakness for the bearish side would see prices finding support at an important price level like this. This next chart is one that we include in the introductory material for new subscribers, helping to make the point about bumpy versus smooth Price Oscillator structures. 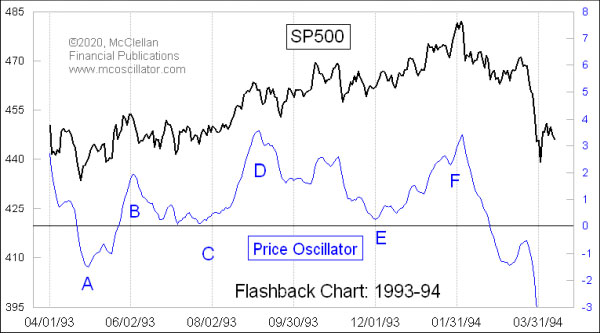
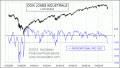
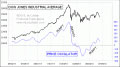
Back in 1993, the SP500 was in a gentle uptrend, but still saw mostly smooth Price Oscillator up moves from A to B, and from C to D. The bumpy down moves from B to C, and from D to E, gave confirmation that the bears were not showing any strength. So even though there were consolidations along the way, the bulls were still strong, and in charge. That picture changed after point E, when the Price Oscillator started a bumpy up move toward point F. The bumpy up structure said that the bullish strength was waning. The uptrend was still able to make marginally higher highs along that weak up move to the final price top, but the bumpy Price Oscillator said that the bulls’ hearts were really not in it, and that trouble could be brewing. And a noticeable decline unfolded from point F into 1994. Price Oscillators do not always have to give us clear messages in this regard. Here is a current chart of the SP500 and its Price Oscillator: 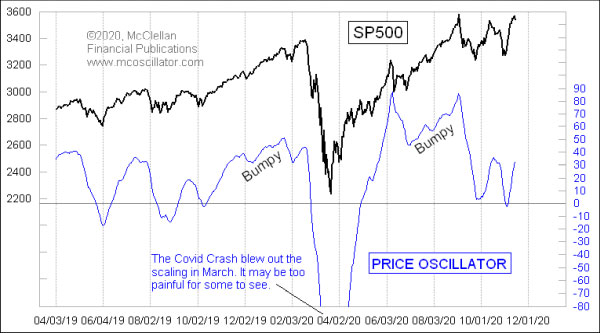
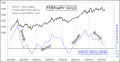
There were some informative bumpy up moves ahead of the February 2020 top and the September 2020 top. Aside from those, there have been mostly smooth up moves and smooth down moves, including right now. So either side could be the strong one right now. Life is not always as neat and pretty as the textbook examples. *** Related Charts ### Tom McClellan
Editor, The McClellan Market Report
email: tom@mcoscillator.com
website: www.mcoscillator.com
(253) 581-4889 Subscribe to Tom McClellan's free weekly Chart In Focus email. Copyright ©1996-2020, McClellan Financial Publications. All Rights Reserved. 321gold Ltd

|