Chart In Focus
Shiller’s CAPE At Very High Level
McClellan Financial Publications,
Posted Oct 22, 2025
Oct 15, 2025
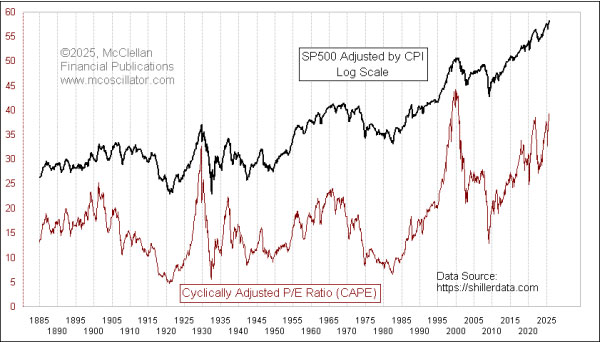
The US stock market is overvalued now by a long list of measures, and that has not mattered yet. That is the key point about valuation - - it does matter, but not necessarily on anyone's schedule. Valuation is a "condition", not a "signal".
Years ago, Dr. Robert Shiller developed his "Cyclically Adjusted P/E Ratio" (CAPE) for the SP500, and he used prior data from the Cowles Commission to extend back all the way to 1871. This week's chart shows Shiller's CAPE, and I left off the first few years of those data as that was when the CAPE's 10-year adjustment process was just getting matured. We can see in this chart that the CAPE right now is really far up there. Only the peak of the Internet Bubble in early 2000 brought a higher reading than this. And it is above the highs of 1929 and 2021. You can fetch the data yourself at https://shillerdata.com.
So if CAPE is not useful as a timing tool, what use is it? The answer lies in asking the data what happens in the years after you see a high reading like this. To get that answer, we need to look at the stock market's performance in a different way.
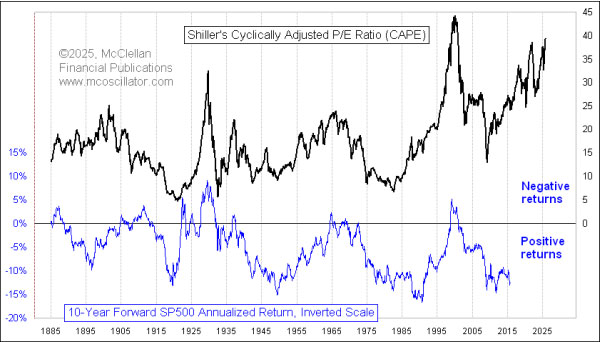
The second chart compares the CAPE to a measure of 10-year forward price returns for the SP500 (dividends not included). I have inverted the scaling on that plot of forward returns to better show the strong correlation. And the plot of forward returns ends in 2015 because the market has not yet told us what the 10-year forward returns after then are going to look like.
The big peaks in CAPE in 1929 and 2000 led to instances of negative 10-year returns. So did the lesser CAPE peak in 1965. The correlation is not perfect, so you cannot say that a CAPE reading of XX will necessarily lead to some specific value for the 10-year forward return. But the correlation is pretty obvious when examining the direction of movement.
This means that the potential for a buy and hold approach working well over the next 10 years is going to be pretty low. Buy and hold investing has its place at certain times in history, and has worked great under the right conditions. But those times were when the market was coming off a very low CAPE reading. The period following the 2009 bottom has been a great example of when one wanted to be a buy and hold investor (the Fed helped with mountains of QE). From 2000 to 2009, one needed to be a good market timer to have an edge, and to survive the 2 big bear markets we had during that period. We appear to be in for a similar period during the next decade when market timing will be essential again.
***
Related Charts
###
Tom McClellan
Editor,
The
McClellan Market Report
email:
tom@mcoscillator.com
website:
www.mcoscillator.com
(253) 581-4889
Subscribe
to Tom McClellan's free weekly Chart In Focus email.
Copyright ©1996-2025, McClellan Financial Publications. All Rights Reserved.
321gold
Ltd

|