Chart In Focus
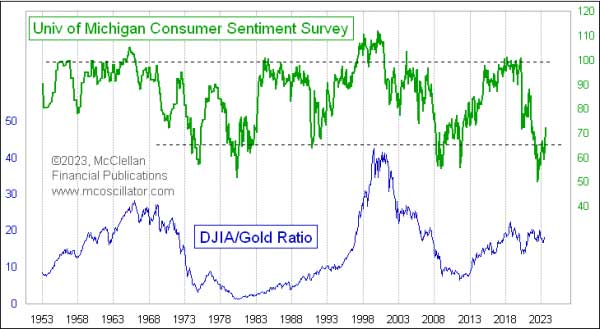
DJIA/Gold Ratio vs. Consumer Sentiment
McClellan Financial Publications, Inc
Posted Aug 16, 2023
Aug 10, 2023
If you are a really long-term investor, then you want to buy stocks when everyone is unhappy, and no one likes the stock market or the economy. And when everyone is elated, that is the time to eschew stocks and turn to other assets.
This week's chart looks at the DJIA/Gold Ratio going back a few decades. And for comparison it shows the University of Michigan's "Survey of Consumer". That sentiment survey data just hit an all-time low reading in 2022, when inflation was really high and consumers were nervous. The survey data are starting to rebound, but thus far the DJIA/Gold Ratio has not moved much at all.
The instances of low UMich survey readings are pretty reliably associated with great lows for the DJIA/Gold Ratio, the moments during the grand sweep of history when one would want to get out of gold and move into stocks. A sharp-eyed reader might point to the UMich survey data's low in 2008-09, after which the DJIA/Gold Ratio did not move up very much. But that was still a moment in history when one would have wanted to be a long-term dip-buyer. The anomaly then was that gold prices went up in 2009-10 as fast as the stock market did, keeping the ratio flat. Another sentiment extreme came in August 2011, after a 19% decline in stock prices following the end of QE2, which put consumers into a bad mood. From that moment until a DJIA/Gold Ratio high in 2018, this ratio more than tripled, as investors decided that they did not like gold any more and the stock market ran higher.
The question now is whether this latest sentiment extreme in 2022 is going to mark another one of those great moments in history. That extreme came about because of high inflation, and the gold coin TV commercials all tell us that gold is supposed to be a great hedge against inflation. So if inflation lies ahead, and gold is going to outperform stocks, then that would make this DJIA/Gold Ratio move downward.
The problem with this thinking is that while gold prices might be helped by inflation, they are harmed by the Fed's remedies to inflation. If you have your money invested in gold right now, you are missing out on earning a 5.4% yield on 3-month T-Bills. That makes owning gold pretty expensive in terms of "opportunity cost", i.e. missing out on the opportunity to earn interest.
But high short-term rates also hurt the stock market, especially when the Fed pushes up rates to above the 2-year T-Note yield as they have done now. And the multiple officials of the FOMC who have made comments about their intentions seem to be saying that the Fed plans to keep this up for a while.
So that 2022 all-time record low reading for the UMich survey data may not turn out to be the great historical bottoming indication this time like it has been in the past, at least not for the stock market by itself. But it is reasonable to expect the DJIA/Gold Ratio to rise as it has before, thanks to gold underperforming more than from stocks outperforming.
***
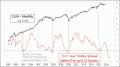
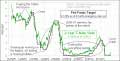
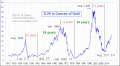
Related Charts
###
Tom McClellan
Editor,
The
McClellan Market Report
email:
tom@mcoscillator.com
website:
www.mcoscillator.com
(253) 581-4889
Subscribe
to Tom McClellan's free weekly Chart In Focus email.
Copyright ©1996-2023, McClellan Financial Publications. All Rights Reserved.
321gold
Ltd

|