Chart In Focus
Seasonality Versus The Fed McClellan Financial Publications, Inc
Posted Jun 15, 2021 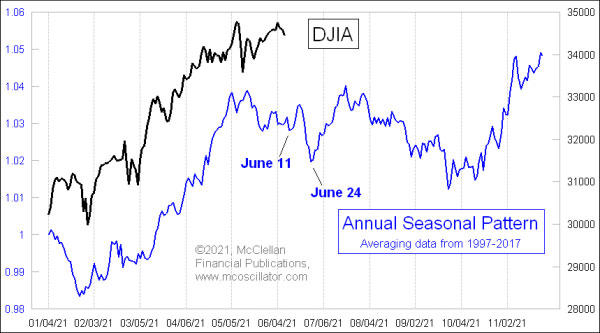
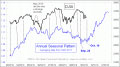
Jun 10, 2021 We all know that we are supposed to “sell in May and go away”. Everyone says so. And so far in 2021, that looks like the operative strategy, since stock prices have been chopping sideways, just like they are supposed to. If the DJIA is going to follow its typical Annual Seasonal Pattern (ASP), then the sideways choppiness is going to continue and get more dramatic, all the way until October. That’s what the ASP says should be happening in a “typical year”. I have been doing this job for a while, and I have not yet lived through a “typical year”. One can average together some or all of the past years of market history, but that does not mean the current market has to comport itself to that notion of what it should do. There is always an unusual condition arising to put some unusual weight on the scales of price movement. This year, the big exogenous factor is arguably the Fed. But as the perennial 800 lb. gorilla in the room, it is hard to call the Fed “exogenous”. 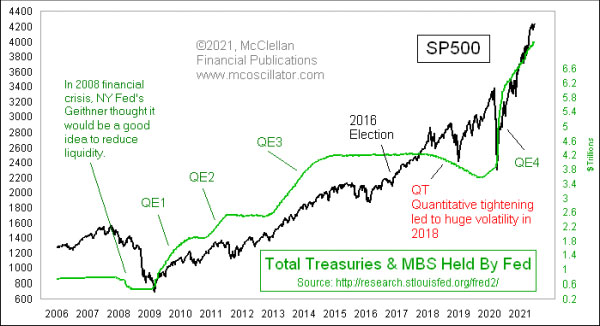
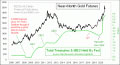
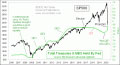
We are in the 4th round of the Fed’s efforts at “quantitative easing” or QE. Before 2009, the Fed used to intervene in less direct ways, by merely adjusting interest rates. The 2008 financial crisis emboldened the Fed to take more assertive action, and now the FOMC members do not seem to know how to let go of these new powers. We know from the first 3 rounds of QE that for as long as the Fed keeps pumping money into the banking system, things are great for the stock market. We also know that when the Fed has tried to turn off the faucet, it has resulted in bad things. The end of QE1 brought us the May 6-7, 2010 Flash Crash. The end of QE2 brought us a 19% decline in a month back in July 2011. The Fed wisened up, and figured out that they should “taper” the ending of QE3. That postponed the problem, but in late 2015 we still saw a China-induced minicrash thanks to the withdrawal of the QE liquidity. Now we see the Fed paralyzed, unable to back away from continuing QE at a rate of more than $100 billion per month, which is still more than the rate seen at any time during QE1, 2, or 3. Inflation is spiking up more than 5% versus a year ago, and the FOMC still thinks that keeping short-term rates at zero is a wise policy. This is obviously stimulative, which is great if you are a stock investor. It is not so great if you are depending on your CD returns to survive off of in retirement. So in the balance of forces equation that is the stock market, how do we know which factor is going to matter more, seasonality or the Fed? My answer: don’t bet against the Fed. If the Fed is still not thinking about talking about tapering, then the stimulus will continue. Seasonality can still matter, and can still produce noticeable effects on the price pattern. But the Fed’s QE can bend the normal seasonal pattern higher. And don’t have any doubt about what happens when QE4 ends. We have seen the outcome of that story before. *** Related Charts ### Tom McClellan
Editor, The McClellan Market Report
email: tom@mcoscillator.com
website: www.mcoscillator.com
(253) 581-4889 Subscribe to Tom McClellan's free weekly Chart In Focus email. Copyright ©1996-2021, McClellan Financial Publications. All Rights Reserved. 321gold Ltd

|