Chart In Focus
Gold Preps For New Trending Move McClellan Financial Publications, Inc
Posted Mar 5, 2016 
March 03, 2016 A high reading for the Choppiness Index means that a new trending move is likely to start. But it does not tell us in which direction. The Choppiness Index was developed by Australian commodities trader E.W. Dreiss. The idea is to quantitatively describe how linear or non-linear the price action has been over the lookback period. For the chart above, that period is 14 trading days. The scaling is from 0 to 100, although prices generally do not approach those extremes. Dreiss noted that a reading below 38 was a sign that the recent trend has been extremely linear, and thus a non-trending period was likely to develop. Similarly, a reading above 62 says that prices have been very choppy, and thus that a new trending move is likely to develop. That latter condition is where we find gold prices right now. Gold reached a blowoff top back on Feb. 11, 2016 and since then it has just been chopping sideways. That has driven up the Choppiness Index to its current high level, which conveys the message that now a trending move is likely to start. A trending move can go either upward or downward, and this indicator will not tell us which. To get that answer, we have to turn to other tools. One can either watch for whichever direction a breakout goes and run with it, or one can look elsewhere for guidance about the direction that is more likely. For that answer, a couple of other charts are showing a compelling message. 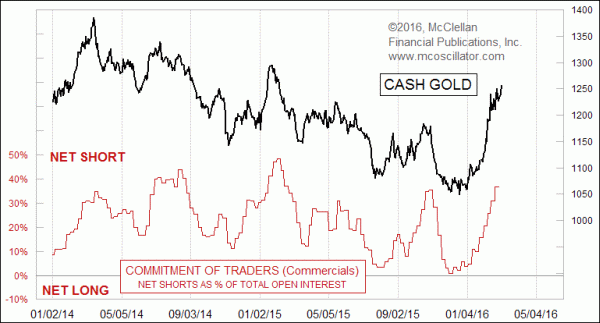
Data from the weekly Commitment Of Traders (COT) Report, published by the CFTC, show that commercial traders of gold futures have returned to a big net short position, much like what they were showing last October just before the drop to a lower price low. The commercial traders are the big money, and thus presumed to be the smart money. When they get to a big skewed position as a group, relative to what they have been doing recently, prices usually move in the direction that this group is betting on. A similar message comes from the gold bullion ETF, GLD. 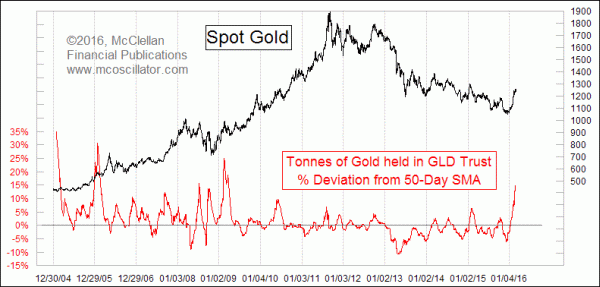
Money has been pouring into GLD at the most rapid rate since early 2009, as investors are chasing the recent gold price pop. Those extra purchases can skew the share price, and so in order to keep the share price close to the net asset value, the sponsoring firm (State Street Global Advisors) issues more shares, and uses the proceeds to buy more gold bullion. This last chart looks at GLD assets, measured in terms of how far the total assets number is away from its own 50-day moving average. When there is a rapid rush like this into GLD, it is a sign of excessive speculation worthy of a top for gold prices. So based on these sentiment indications, the likely direction for the new trending move suggested by the Choppiness Index would be downward. *** Related Charts Oct 30, 2015
COT Data For Gold At Topworthy Level | Feb 04, 2016
GLD Assets Show Resurgent Interest in Gold
| Aug 15, 2014
Grains Down, Beef Up | ### Mar 3, 2016
Tom McClellan
Editor, The McClellan Market Report
email: tom@mcoscillator.com
website: www.mcoscillator.com
(253) 581-4889 Subscribe to Tom McClellan's free weekly Chart In Focus email. Copyright ©1996-2016, McClellan Financial Publications. All Rights Reserved. 321gold Ltd

| 