|
|||
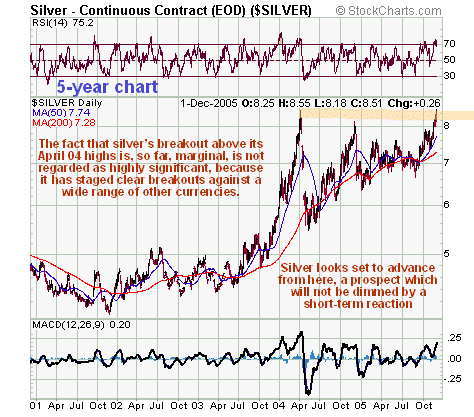
Gold and Silver Market UpdatesClive Maund Gold  The 1-year chart shows the strong advance during November and into the start of December that took gold above $500, an event that brought out calls for a reaction, on the basis that "they" won't gold countenance gold above $500, and will pull out all the stops to beat it back down again. Of course, the reality is that if it drops back below $500 again from here, it will be because it is currently overbought, technically that's all there is to it. As we can see on this chart, gold is pushing it normal overbought limit, as shown by the RSI and MACD indicators at the top and bottom of the chart, a development which, even if it doesn't lead to consolidation/reaction, normally forces any further progress to be at a measured rate, in order to keep the overbought readings within reasonable bounds. In addition to oscillators being close to overbought limits, a large gap has opened up between the price and its 50 and 200-day moving averages, and between the moving averages themselves, a situation which indicates that the end of the move is not too far away. The 1-year chart is pointing to consolidation/reaction, and soon. It is considered most likely that gold will trade sideways for some weeks around the current level, although it could react back to the new support level that has developed at and below $480.  For further clues regarding the outlook over the intermediate-term, we will turn now to consider the 5-year chart. On this chart we see that gold is now looking very impressive indeed. The strong advance during November broke the price above a potentially bearish upper trendline - bearish because, had it turned the price back, it would have resulted in a "Rising Wedge." This line is shown in pale blue on the chart. An upper parallel to the operative trendline has been drawn on the chart, and the break above the pale blue trendline, a bullish development, should lead to the price advancing swiftly to the parallel return line, meaning that the current intermediate advance is likely to exhaust itself in the $520 - $530 area. Now, combining the conclusions drawn from consideration of the 1-year chart with those drawn from the 5-year chart, the most likely scenario would appear to be that gold consolidates or reacts mildly short-term, as described above, but then pushes on further to conclude the current intermediate uptrend in the $520 - $530 area, after which a lengthier period of consolidation/reaction is to be expected. There is one further scenario that is worthy of mention. It is quite clear on the 5-year chart that gold's rate of rise is accelerating, and if it succeeds in breaking above the upper return line, provided that such a breakout is not a "throwover" move that would be followed by a swift reversal, then a really steep advance could follow. Such a move could be very profitable for nimble traders, although it could not be expected to last very long as it would be unsustainable.  Finally we will take a brief look at the 6-month US dollar chart. Despite the dollar's mild reaction of the past couple of weeks, it is clear on this chart that it remains in a vigorous uptrend. The reaction followed a strong advance at the start of November, and brought the dollar back to successfully test significant support above its rising 50-day moving average. While it may drift sideways for a couple of weeks towards its rising lower trendline, it is considered likely that it will take off higher again towards the upper return line of its trend channel in due course, and although gold has had the wind at its back over the past few weeks as the dollar has weakened, albeit marginally, such will not be the case if the dollar suddenly strengthens again. It is true that gold has partially broken its inverse relationship with the dollar recently, but this may be only a temporary phenomenen, so that gold is more likely to correct at times when the dollar is rising strongly. Silver  The 5-year chart shows the overall situation. On this chart we can see the very steep advance late in 2003 and into 2004 that resulted in an extremely overbought condition, which led to the lengthy consolidation pattern that followed. However, the strong advance from September has taken the price well above the highs earlier in the year and swung the moving averages into bullish alignment, and thus looks like a breakout drive that should take out the highs of this large pattern and usher in an important new uptrend. In fact, as already mentioned, the price has already marginally exceeded the April 04 highs. Thus, silver is in position to begin a substantial intermediate uptrend from here. It is overbought short-term and this may result in a short-term reaction, but any such reaction should simply put it in better technical shape to stage a significant advance. It should be noted that the current overbought condition is nowhere near as extreme as it was in April 04. Clive Maund Clive Maund
is an English technical analyst, holding a diploma from the Society
of Technical Analysts, Cambridge, England. He lives in Chile. Copyright ©2003-2011 CliveMaund. All Rights Reserved. Charts courtesy of StockCharts.com. |
