|
|||
Gold and Silver Market UpdatesClive Maund "How are you?" Gold We'll now look at the charts for gold against various currencies, starting with the US dollar itself. The time period selected for all the charts is 5 years, as this shows the bull market in its entirety. Gold looks good on the US dollar chart, having broken higher again over the past week, and is now advancing away from the strong support at and beneath $460. The overall look of this chart is bullish with rising moving averages. The strong advance last week resulted in it breaking above the inner trendline shown, which is desirable to obviate the risk of a bearish wedge developing. It is now likely that it will rise toward the parallel trendline, even if it corrects short-term to alleviate the current overbought condition.  If gold looks good on the standard US dollar chart, then it looks super-bullish on the Euro chart. On this chart we see that having broken out above 4-year resistance against the Euro in September, it is now in a powerful uptrend, and broke strongly higher again last week.  We have all heard about recent Euro weakness, so what about gold against some other European currencies? If we now look at gold in Swiss Francs, the top investment currency, we quickly see that it is the same story.  The British Pound? - no need to waste words - the chart quickly reveals that it is the same story.  Looking further afield what about gold against the Japanese Yen? Gold had been firming against the Yen for some time, and started to lift off against this currency back in June, with the advance accelerating sharply in September.  The South African Rand? - after forming a large base area against the Rand, Gold has finally broken out upside over the past couple of months.  Conclusion: even if gold's recent progress against the US dollar has looked a little pedestrian, it is in a roaring bull market against many of the world's currencies, WHICH ONLY BEGAN IN EARNEST THIS YEAR, and given the multi-year incubation of this bull market, it is not likely to end anytime soon. The XAU Philadelphia Gold and Silver index, shown below, broke out above its 2004 highs this past week, a very bullish signal, and the HUI GoldBUGS index can be expected to follow suit shortly and break out above its big resistance toward 260. This combined breakout is expected to trigger powerful gains in gold and silver stocks.  Everything in life is relative, so next time someone asks "How are you?" the correct answer is, of course, "Compared to what?" Silver In this update we are going to look at silver charted against various currencies. But first we will quickly review the chart for silver in US dollars. A 5-year timeframe will be used for all the charts, as this shows the bull market in its entirety, and enables us to overview the big 18-month consolidation pattern in silver on the charts. The 5-year chart for silver in US dollars shows that silver is now in position to have a go at taking out the key resistance in the $8 - $8.40 zone, and appears to be in the process of doing just that. As already stated, silver's recent performance against other currencies suggests that a breakout against the US dollar is only a matter of time, and likely not much time. 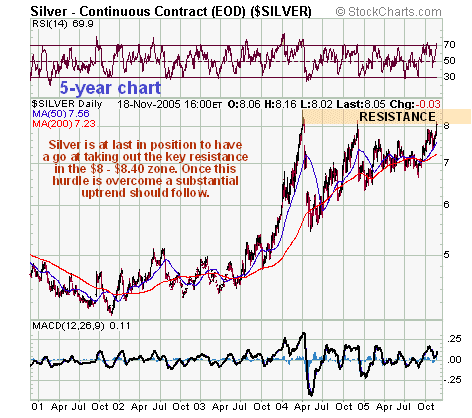 The chart for silver against the Swiss Franc is rather similar, with silver challenging its April 04 high, the main difference being the more pronounced strengthening against the Swiss Franc in recent months. 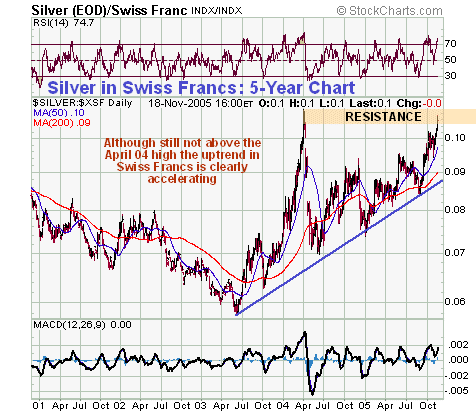 The chart for silver against the British Pound is very encouraging as last week it broke strongly to a new high. 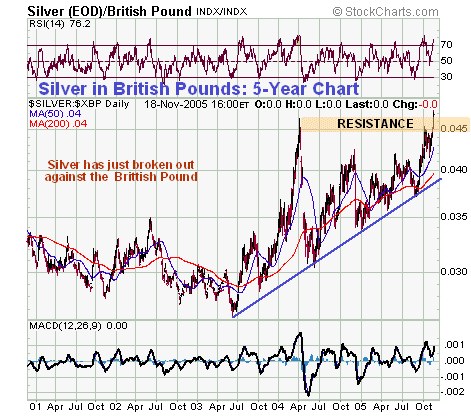 Against the Japanese Yen, silver had actually broken out to new high back at the start of October, however it was not by a convincing margin. This changed last week with silver advancing well above the 18-month trading range to a clear new high. 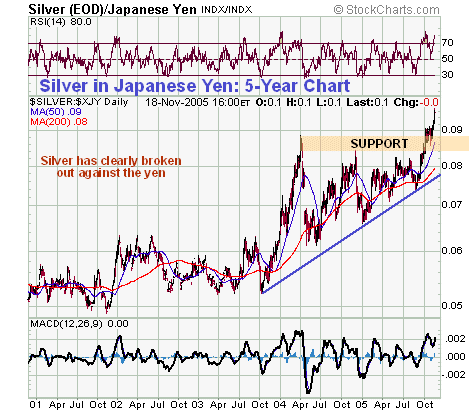 Conclusion: silver has already broken out from its large 18-month trading range against a number of currencies, signalling the start of a new intermediate uptrend. This action against other currencies indicates that a similar breakout against the US dollar is only a matter of time, and likely not much. This breakout against the US dollar can be expected to occur whether the dollar continues to advance or not, although with the dollar vulnerable to some sort of reaction following recent strength, the "ball could be kicked downhill", as a reaction by the dollar will make a breakout by silver on the US dollar chart that much easier. With the XAU Philadelphia Gold and Silver index now breaking out from a 2-year trading range, it seems perfectly reasonable to expect silver stocks to start advancing in earnest shortly, particularly the large and mid-caps. Therefore this is believed to be a good time to get into these stocks. 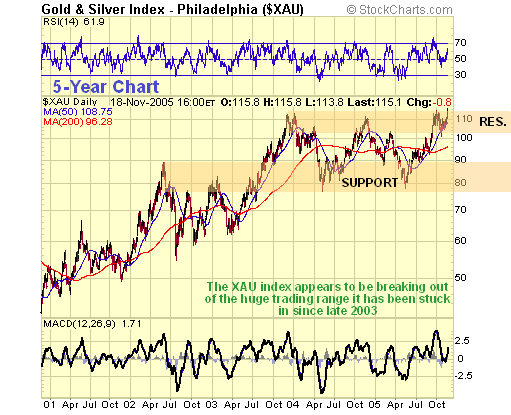 Clive Maund Clive Maund
is an English technical analyst, holding a diploma from the Society
of Technical Analysts, Cambridge, England. He lives in Chile. Copyright ©2003-2011 CliveMaund. All Rights Reserved. Charts courtesy of StockCharts.com. |
