|
|||
Gold and Silver Market UpdatesClive Maund Gold The current reactive phase in gold can be expected to continue until the dollar rally has run its course, although as the limited retreat so far and the rally a few days demonstrate, the strong underlying support can be expected to prevent a serious decline. The worst case, in the event of continuing dollar strength, would be a retreat to the vicinity of the 200-day moving average, i.e. to the $445 area, which would be regarded as a buying opportunity in expectation of a renewed uptrend. However, as we will see later when we look at the long-term chart, there is an important long-term uptrend that must hold to keep the bull market in gold alive.  The 1-year chart shows the small top area that developed in late September and October and the reactive phase that is now underway. On this chart we can also see the impressive body of support that now underpins the price - the September rally took the price sufficiently above the preceding lengthy trading range for sellers in that range to rue their decision to sell and want back in, as near to where they sold as possible, thus generating potent underlying support. The 50-day moving average is out of whack with the 200-day - way ahead of it, as a result of the overbought condition that had developed by mid-late September, and this is an important reason for the corrective phase that we are now in. We will now look at the dollar chart in an attempt to gauge how far the current rally is likely to get, for despite gold's intrinsic strength at this time, this can be expected to determine the extent of the current short-term reaction in gold. Observe that a 2-year timeframe has been selected for the dollar chart, so that we can pinpoint the origin of important dollar resistance.  About a week ago the dollar broke out from a menacing looking potential double-top formation, and it is very clear on the 2-year chart that the strong rally in the dollar this year had stalled out beneath resistance arising from the multiple peaks around the 90 level that occurred during 2004. Examining the action in 2004 we can see that this resistance continues right up to the high for that year, which is at about 92.3. Now, given that the dollar is now becoming extended and overbought relative to its moving averages, which incidentally are now in decidedly bullish alignment, and as shown by its short-term oscillators, following the strong break higher a week or so ago, it is viewed as highly unlikely that it will succeed in breaking above the 2004 highs just above the current level on this run, without first consolidating/reacting. However, the dollar breakout above the potential double-top was, on the face of it, a decidedly bullish development, and after some consolidation in the 92.3 area it could break higher again, and if it does it will be this that pushes gold down towards its 200-day moving average. However as we will see at the end of this gold update, the dollar COT charts suggests that the dollar is about to top out, at least for the short-term, very soon.  With the retreat from the October high a potentially bearish wedge pattern has appeared on the long-term 5-year gold chart. In the light of the latest dollar strength this will need to be carefully watched. A break of the lower trendline will obviously be bearish, and it will take a break above the top line to obviate the implications of this pattern. To end on a positive note - for gold, that is, not the dollar, the dollar COT chart should strike dread into the hearts of those long the dollar, at least short-term; it shows the Commercial short positions and the Large Spec long positions going off the scale. This is normally the precursor to an abrupt reversal. 
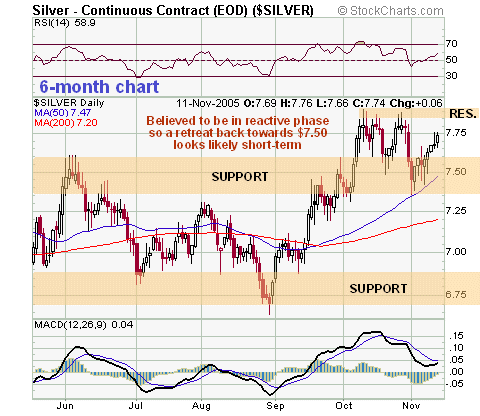
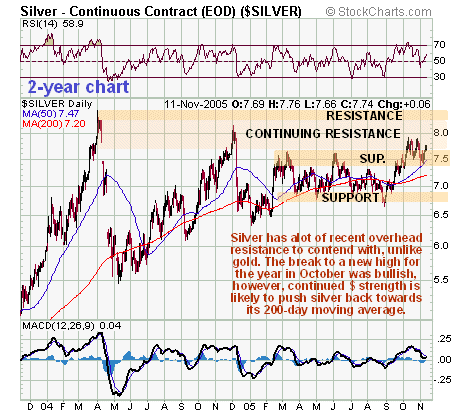
 As pointed out in the last update, there is a big difference between silver and gold at this time that is very clear on the 2-year silver chart, and that is that while gold has virtually no recent overhead resistance to contend with, silver has a lot, between the current price and the April 2004 at about $8.40. Although silver succeeded in breaking out to a new high for the year in October, it is clearly finding it heavy going rising up through this resistance, especially as, like gold, it is not getting any help from the dollar at this time.  As detailed above in the Gold Market update, it is considered likely that the current dollar rally will pause to consolidate in the 92.3 area, i.e. a little above where it is now, and then break higher again, which can be expected to result in gold retreating further towards its 200-day moving average to complete the current reactive phase, and silver can be expected to do likewise, which would result in it dropping back to the $7.20 area. Finally, a breakdown by gold from its potentially bearish rising wedge pattern, which might result from continued vigorous gains by the dollar coupled with a rally in the broad stock market, both of which are looking increasingly likely, would have bearish implications for silver, which, unlike gold, does not have a clear level at which it can be said to have broken down. Clive Maund Clive Maund
is an English technical analyst, holding a diploma from the Society
of Technical Analysts, Cambridge, England. He lives in Chile. Copyright ©2003-2011 CliveMaund. All Rights Reserved. Charts courtesy of StockCharts.com. |
