|
|||
Gold & Silver Market UpdateClive Maund Gold Although yesterday's reaction may have seemed severe, it is was actually perfectly normal, and served to bring things off the boil, which is necessary if the larger uptrend in gold and silver is to continue. We were expecting trouble last week on the site when it was made clear that the dollar was deeply oversold and gold was extremely overbought, and it was advised to take profits in most Traded Options (Calls) - and it was further pointed out that impending weakness would provide an excellent opportunity to increase positions in big gold and silver stocks, especially those that had run away and become ridiculously overbought, and big golds especially, such as Newmont, got hammered yesterday. 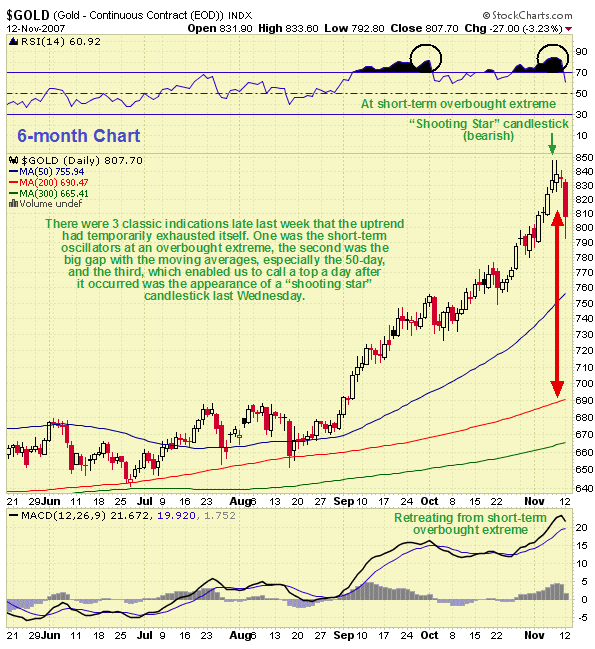 There were 3 factors that led to the warning being issued last week, which we will now review briefly on the 6-month gold chart. The first was the critically overbought levels reached by short-term oscillators such as the RSI and MACD indicators shown at the top and bottom of the chart. The second was the yawning gap that had opened up between the price and its 50 and 200-day moving averages, and the third was the "shooting star" candlestick that appeared in the middle of last week after a parabolic ramp. The latter manifestation was what triggered the warning on the site, and it is worth explaining what the appearance of such a candlestick after a parabolic acceleration means. As we can see the shooting star candlestick has a small real body (the trading between where it opened and where it closed), and a long upper shadow, making it look like a shooting star streaking across the sky, or at least down towards you. What this means is that the price advanced significantly intraday but couldn't hold its gains and closed back down near the low of the day, which means that the bears are gaining the upper hand. Never forget that common sense and experience generally triumph over high IQ's and qualifications in this business, as in many others. We've all met the vulgar but successful businessman with plenty of drive and common sense, and also the intellectual with an IQ of 200, dressed in a shabby suit and living in an attic apartment. 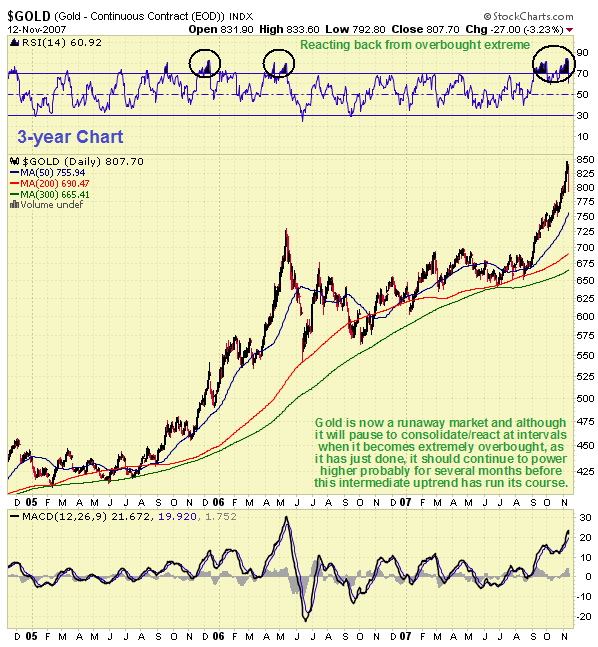 That's enough of a review. The most important thing now is to decide whether yesterday's savage shakeout was just a short, sharp shock to alleviate the overbought condition, or whether it marked the start of a more prolonged reaction. With regard to this the most important thing to consider is the condition and outlook for the dollar. For various reasons, fundamental and technical, the outlook for the dollar remains awful, and therefore any countertrend relief rally in the dollar is not expected to get far. On the 6-month dollar index chart shown, we can see that it could rally back to towards resistance in the vicinity of its steeply falling 50-day moving average, however, given all the negatives (and this does take contrarianism into account), it is thought unlikely that it will get beyond about 77, so it probably did about one third of its countertrend rally already yesterday. It is thus thought unlikely that gold will react much more, if at all. Yesterday going into today could have been the entire correction, but even a worst case scenario should involve little more than a gentle downtrend for several weeks before the advance resumes in earnest. Prospective buyers should therefore use shakeout days of the kind we saw yesterday to accumulate gold. Yesterday was a nasty shock for gold stock investors, who were like party revelers drinking the champers and doing the conga suddenly finding themselves being hosed down by a water cannon. This is why we have not been chasing the big stocks up over the past week or two. The vicious shakeout of the past few days is viewed as providing an opportunity to buy at better prices, even if we see slightly lower prices in coming weeks, which may not happen at all. Silver "Thought I'd broken out didn't you? - GOTCHA!!" Actually, silver is in the process of breaking out, and a reaction back into pattern was inevitable if gold hit the skids. With the picture for silver now looking at least as bullish longer term the reaction of the past two days is viewed as providing a buying opportunity. 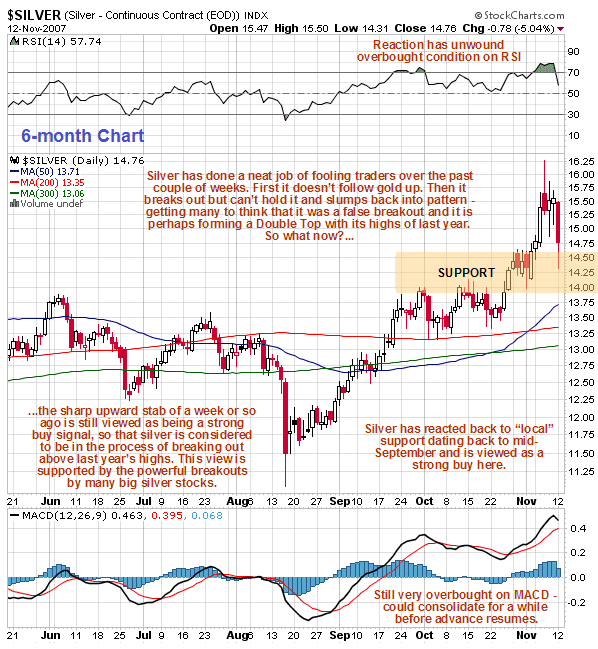 On the 6-month chart we can see how the price reacted sharply yesterday along with gold. In one day this plunge went a long way towards unwinding the short-term overbought condition that had developed as a result of the very bullish spike breakout move of a week or so ago, as can be seen from the RSI indicator at the top of the chart. The MACD indicator at the bottom of the chart is still at a high level, but this will quickly moderate if silver stays around current prices for a few days. 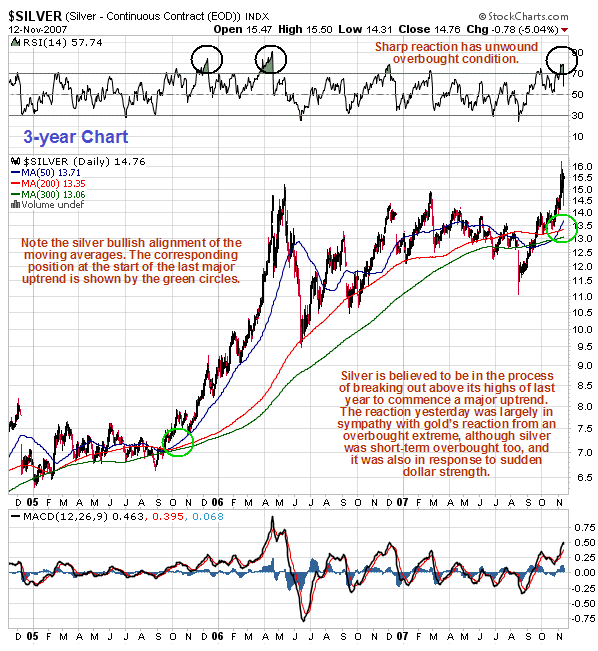 On the 3-year chart we can see how silver has still not completed its breakout away from the large consolidation pattern of the past 18 months, but as already mentioned the sharp advance about a week ago is viewed as signaling that it is in the process of doing so. This being so the current reaction is viewed as providing a buying opportunity. Even if the reactive phase continues for several more weeks, we are unlikely to see the price retreat much more. An important factor supporting the view that silver is in the process of breaking out is the powerful high volume breakouts that occurred in big silver stocks about a week ago, a fine example being Coeur d'Alene which we bought several days before it broke out, having detected strong evidence of accumulation. The current reactions by these stocks back to test strong underlying support are a typical post breakout occurrence. Nov 14, 2007 Clive Maund
is an English technical analyst, holding a diploma from the Society
of Technical Analysts, Cambridge, England. He lives in Chile. Copyright ©2003-2011 CliveMaund. All Rights Reserved. Charts courtesy of StockCharts.com. 321gold Ltd |
