|
|||
Gold and Silver Market UpdatesClive Maund Gold  Looking at the 1-year chart we can see recent action in detail. The September breakout was an important technical event, particularly as it occurred at a time of dollar strength, which is reflected in the charts for gold in other currencies, notably the Euro. Due to the fact that gold broke significantly above its earlier peaks there has been a substantial change in psychology, so that the big reaction called for by some writers, on the basis that "it always gives back a large percentage of gains" is considered unlikely to occur. As pointed out in the last update, a 9-month period of consolidation is not normally followed by 2 weeks up and that's your lot folks. Furthermore, gold's strong advance in September took it clear above a zone of strong resistance at the top of the 9-month consolidation zone in the $448 - $458 area, and this resistance zone has now become a zone of support that is expected to limit any reactions, so that any retreat by gold into this zone in coming weeks will be regarded as a buying opportunity, particularly if the Commercial's short interest position drops back at the same time.  As already alluded to, gold's upside breakout in September was an important technical event. Had it been due simply to dollar weakness, as was so often the case in the past, it would have been nowhere near as significant, but it was not. It happened at a time of dollar strength, and this is clearly demonstrated by the chart for gold in Euros, on which we can see a strong breakout above a multi-year resistance level. It had been remarked upon in the past that once this happened we would be looking at a real international bull market in gold, rather than an uptrend that was simply the inverse of the US dollar's downtrend. So this breakout was a very positive move by gold with long-term significance. The 5-year chart provides an overview of the Gold bull market to date. On this chart we can see that having just broken above another resistance level, there should be considerably further to go before the current intermediate uptrend has run its course.  We are now in a situation where gold is digesting its September gains, and with the Commercial's short positions at a high level, this looks set to continue, possibly for some weeks more, with gold likely to test the support in the $448 - $458 area. However, due to the strength of this support, it is considered to be unlikely that it will drop any lower than this. September's breakout signalled a new intermediate uptrend that should have substantially further to run, which means that the action since mid-September is short-term consolidation that is allowing the overbought position to unwind, thus creating the potential for renewed advance.  To recap, gold is viewed as a buy on short-term reactions back into the $448 - $458 area, for a continuation of the current intermediate uptrend that is expected to take the price to new highs.
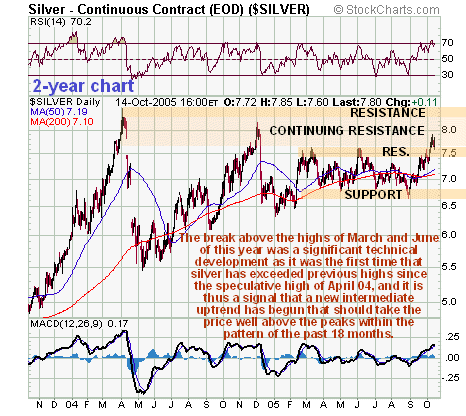
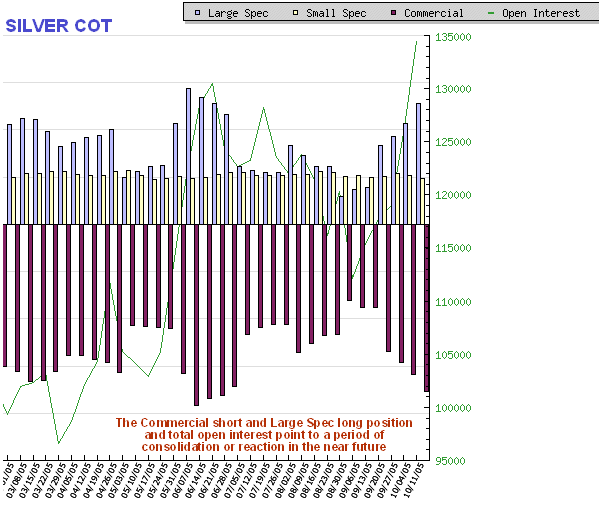
 However, like gold, the Commercial short position in silver, and total open interest, has continued to rise, and it is now approaching an uncomfortably high level. As with gold, this tends to reduce the chances of the uptrend continuing in the near future and points to continued reaction/consolidation over the short-term.  Unlike gold, silver has not staged a breakout above a clearly defined resistance level, and it cannot be said to have broken out of the pattern of the past 18 months until it succeeds in breaking above the April 04 high around $8.50. This being so there is no clearly defined point or even zone where we can expect any short-term reaction to terminate. Having said that, however, it is does not look as though it will react back much, especially given that it broke out to a new high for the year over the past couple of weeks. It is therefore expected to consolidate or react back, but not by much, over the next few weeks, during which time the Commercial's short interest and the total open interest should drop back from their current high level, which will open up the possibility of a continuation of the still young intermediate uptrend and a challenge of last year's highs. Should it carry on higher short-term, with the Commercial's short interest continuing to grow, or remaining at a high level, then it will invite a correction. Clive Maund Clive Maund
is an English technical analyst, holding a diploma from the Society
of Technical Analysts, Cambridge, England. He lives in Chile. Copyright ©2003-2011 CliveMaund. All Rights Reserved. Charts courtesy of StockCharts.com. |
