|
|||
Gold and Silver Market UpdatesClive Maund Gold While a significant short-term rally looks probable, the intermediate outlook remains bearish, because of the breakdown in the commodity complex and the outlook for the dollar, which we will examine in this report. On the 5-year gold chart we can see that it remains oversold as shown by the oscillators at the top and bottom of the chart, and it is on important support that should generate a rally. A 300-day moving average has been appended to this chart instead of the usual 200-day, for as we can see, gold has found support in the vicinity of this average throughout its 5-year bull market, and proceeded to advance again. This time it is different however, for although it is reasonable to expect a rally here, especially given the strong support in this zone, we shouldn't ordinarily expect the rally to get too far. This is because gold has been in retreat from a spike top that occurred in May, and because commodities generally have broken down from their long-term uptrend. The word "ordinarily" is used in the last sentence with good reason, for even as you read this, US naval forces are steaming in the general direction of Iran, and if the Neocons do launch an attack on this country soon, as is quite possible, you are going to quickly wish to be long gold and oil, along with a lot of other people who will suddenly have the same idea. 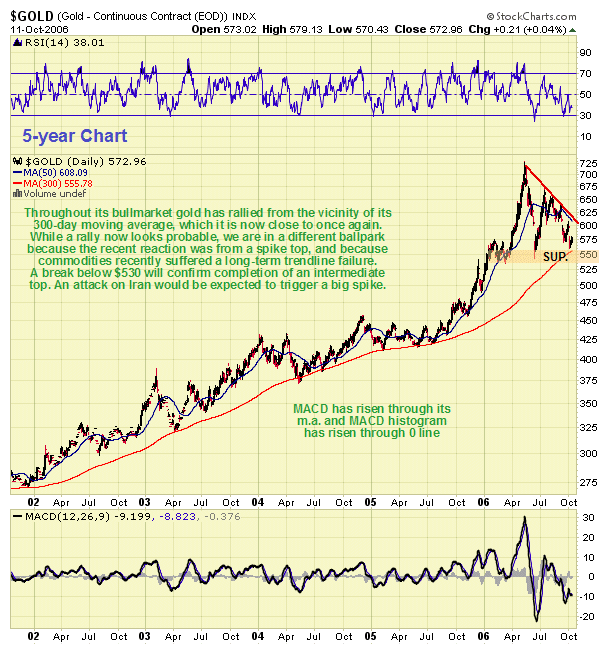 So, as traders, how do we handle this situation? Fortunately, due to the proximity of close support, a clear and effective strategy can be implemented. Gold may be bought anywhere between the current price and the lower limit of the strong support at $530, but exited immediately on a break below $530. It is considered unlikely that it will drop significantly now before a rally gets underway. This strategy enables the buyer to capitalize on a short-term rally, that is likely to take the price to the $610 area, but also be in position to capitalize on a windfall rally in the event of an attack on Iran. The dollar has had a good run in recent days that has led to it being overbought at an important resistance level. This is another factor pointing to a short-term advance in gold. 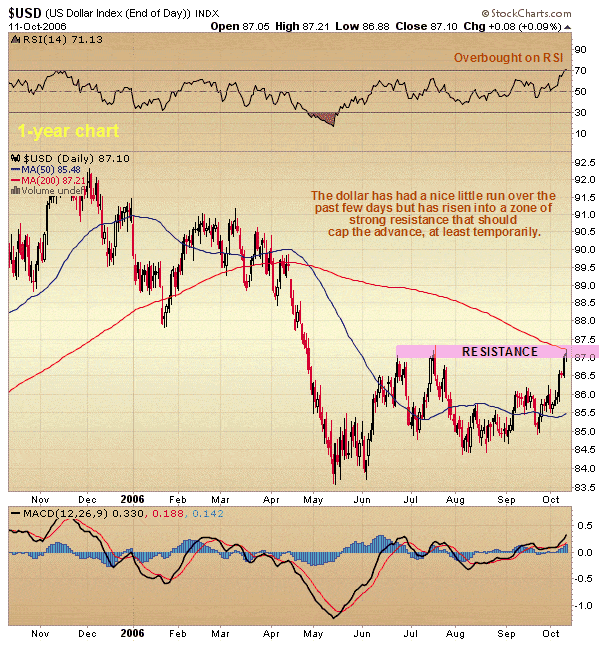 Over a longer timeframe we should keep in mind the bearish implications of the commodity breakdown shown on the 5-year CRB commodities index chart shown below. 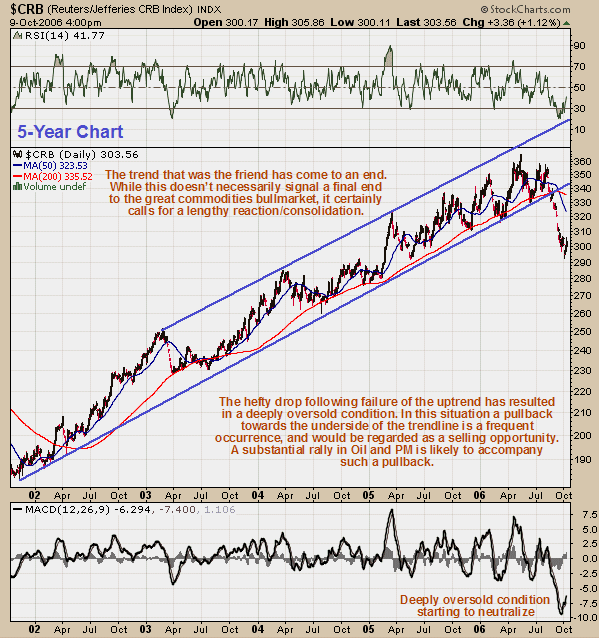 Another worrying development for those long Precious Metals is the appearance of a giant potential Head-and-Shoulders bottom on the US dollar chart. It is not yet complete, therefore it is not conclusive, but nevertheless it would unwise not to keep this in mind. Most everyone is bearish on the dollar, which is in itself bullish. Who knows, maybe the Neocons will realize their dream of taking over the world, and then you will trade in dollars at the point of a gun. 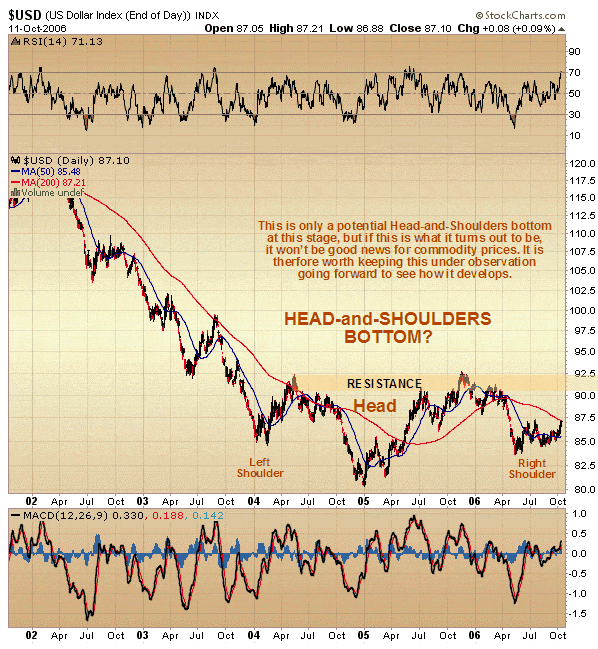 Silver The arguments set out in the Gold Market update, above, apply equally well to silver at this time. Silver is not at such an obvious support level as gold at this juncture. An experimental 300-day moving average has been applied to the silver chart as with gold to see if we have a fit. In the past it fits quite well, as we can see on the 5-year chart, although the standard 200-day works better on the recent reaction. 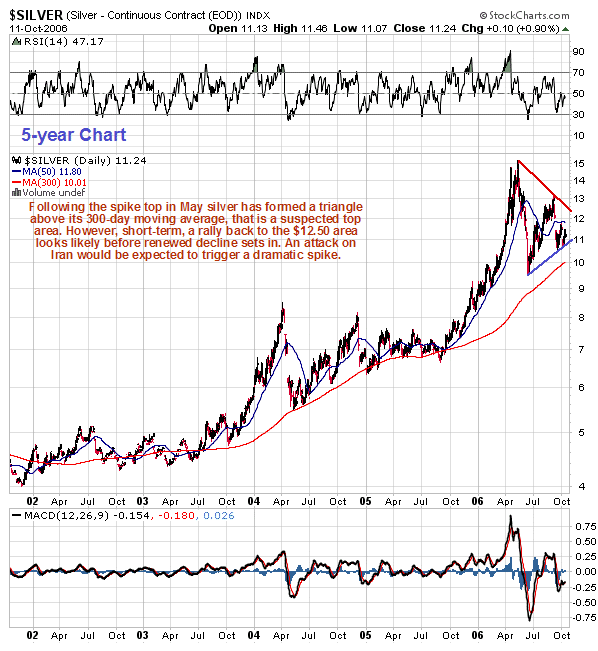 Like gold, silver is expected
to stage a tradable rally soon from about the current level,
which, barring an attack on Iran, is likely to get up to about
$12.50 before it rolls over again. The parallel stop loss point
to that for gold would be failure of the support at $9.50, but
as this would result in an unacceptably large loss for anyone
buying around the current level, it would make more sense to
cut losses in the event that it breaks below the recent low at
$10.50, despite their being some risk of being whipsawed out. Clive Maund
is an English technical analyst, holding a diploma from the Society
of Technical Analysts, Cambridge, England. He lives in Chile. Copyright ©2003-2011 CliveMaund. All Rights Reserved. Charts courtesy of StockCharts.com. |
