|
|||
Gold Market UpdateClive Maund Gold is struggling to stay above support at the top of the triangle it broke out of early-mid August. With silver having broken down through important support on Friday (although this may be a shakeout), and the latest COT figures looking grim, the probability that gold will remain above the current support for long is regarded as slim. The most troubling development for gold bulls over the past few weeks is the ballooning of the Commercial short positions and the Large Spec long positions. This was picked up on on the site and a short-term top was called in an article looking at the COT figures on 14th August. However, since that time these figures have gone from bad to worse, so that, although gold's chart still looks quite positive, the somewhat alarming COT figures urge caution at this point. That said, these numbers can change rapidly from week to week, and the current bearish bias may of course ease, so we will continue to pay close attention to them in coming weeks. Another factor that gives major cause for concern is the fact that, despite its recent dip, the dollar has undeniably broken out of its long-term downtrend. The strong advance in May and June has taken the 50-day moving average way above the 200-day, and the latter has now turned up, a technical event known as the "Golden Cross", and this is a classic signal of a new bull market. Given the potential implications of this development for gold, the term is kind of ironic. Many of us know the innumerable reasons why the dollar "should" go down, but it could simply be, going forward, that it's the "best of a bad bunch". For a bull market to be confirmed, the dollar will have to break above its May 04 high (see 5-year chart below) Now we will look at the charts to graphically examine recent developments. The 1-year chart for gold shows the break higher, the subsequent reaction from the return line of the green channel - presaged by the COT figures, and the current struggle to remain above the support near the top line of the triangle and above the 50-day moving average. Should the price drop back into the triangle, as now expected, it is very important that it does not break below the lower line of the triangle. 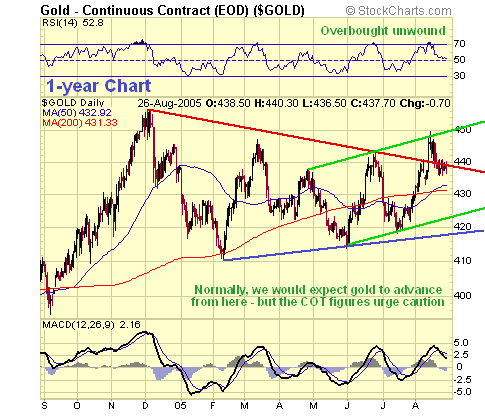 The longer-term 5-year chart shows the - so far - marginal break of the long-term uptrend. However, should the price break below the lower boundary of the triangle, and the 200-day moving average turn down, we will have no choice but to turn bearish. This chart also shows the origin of the support underpinning the current triangle - the congestion area beneath the twin peaks in 2004. 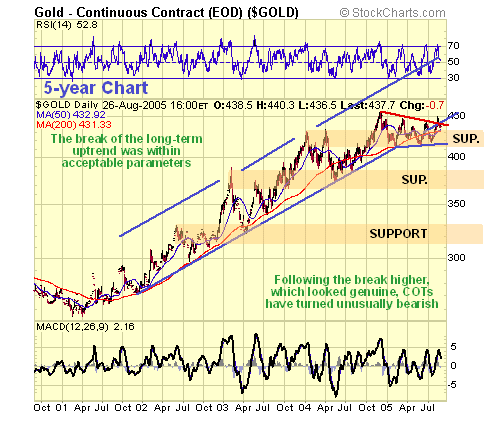 As the dollar continues to be of crucial importance in determining the fate of the gold price, we will now look at the dollar charts. On the 1-year chart we see the drop in late July and the breakdown from the steep uptrend in August. This, followed by the sharp drop below 87.5 later, is what caused gold to break higher. An intermediate top formed in June and July, and a breakdown was predicted on the site, largely due to the toppy looking action developing beneath a zone of heavy resistance. Notice how, having broken down from the intermediate uptrend, the subsequent rally terminated exactly at the underside of the channel and the 50-day moving average. Normally, after such a breakdown, we would expect the dollar to react back at least towards the strong support level shown beneath at around 85. However, the COT figures, which we will come to next, tell a different story. They suggest that the dollar reaction will not run back so far, or that it may even be close to completion. The strong advance during May and June looks like an impulse wave, the first wave of a bull market, and this view is given weight by the fact that we have since seen the 200-day moving average turn up, but, as stated above, for this to be confirmed, the dollar would need to climb above its May 04 highs at around 92. 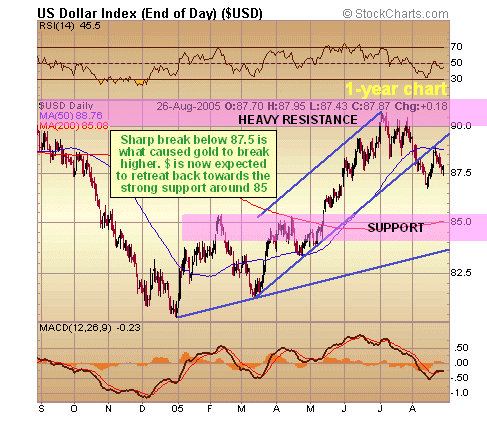 The 5-year dollar chart shows the breakout from the long-term downtrend, the strong run towards the zone of heavy resistance towards 90, that stopped the advance and led to a reaction, and the now rising 200-day moving average. Although the latter is a necessary signal that a new bull market has begun, it will need to be confirmed by a break above the May 04 high, until then the dollar should be viewed as being in a giant trading range between support at the low at the end of last year just above 80, and resistance in the 90 - 92 area beneath the May 04 high. 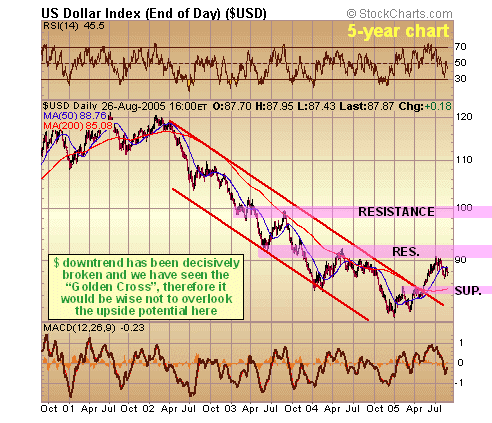 The latest COT figures make very ugly reading for gold bulls with the Commercials short positions and Large Spec long positions having ramped up to their highest levels by quite a margin so far this year. We caught the start of this trend which was why a near-term top in gold was called on 14th August, however, it was not expected to continue to balloon in the way that it has. We have already observed in the past that such a situation nearly always (always in the writer's experience at least) precedes a decline. For this reason gold is expected to drop back into the triangle pattern and quite possibly test the lower boundary of the triangle, failure of which would be a significant bearish development. 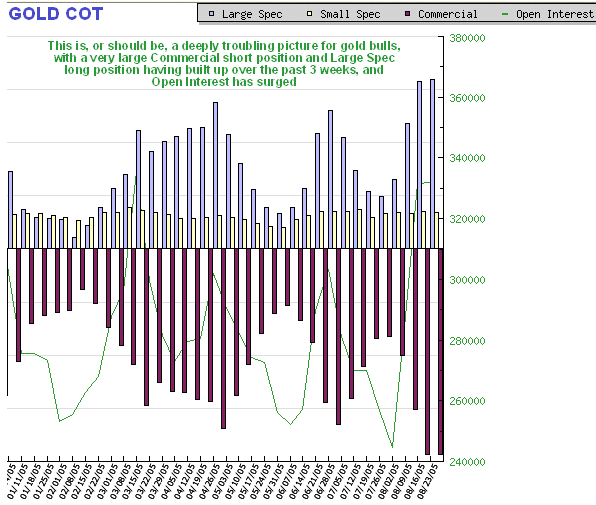 Aug 29, 2005 Clive Maund
is an English technical analyst, holding a diploma from the Society
of Technical Analysts, Cambridge, England. He lives in Chile. Copyright ©2003-2011 CliveMaund. All Rights Reserved. Charts courtesy of StockCharts.com. 321gold Inc
|
