|
|||
Gold & Silver Market UpdateClive Maund Gold The outlook for gold turned decidedly more bullish last week when it broke above the confines of its "Distribution Dome" for the second time in the space of as many weeks. This breakout, which is less likely to fail than the last one did, has once again put gold in position to break strongly above last year's highs, an event made more and more likely - some would say inevitable - by the crumbling dollar. 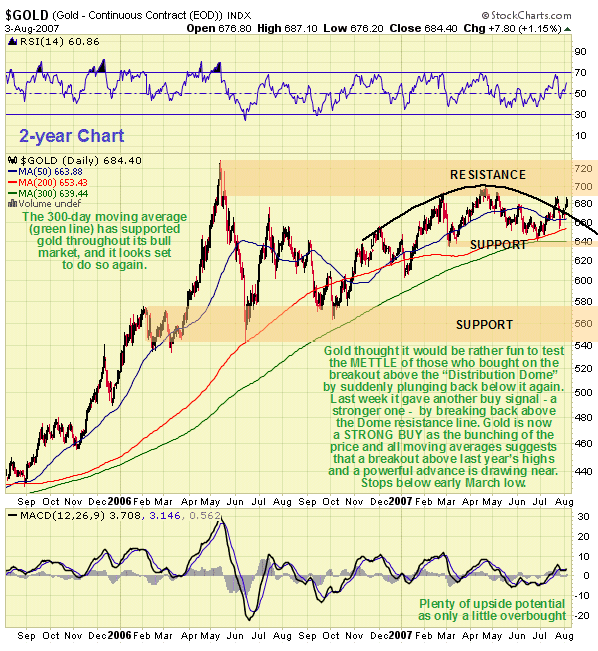 On the 2-year chart we can see how gold's upside potential is increasing with time. It is above the Dome, which had been capping the price, and now only about $40 below last year's highs, and since it is now not at all overbought it could quickly make up this ground and vault above $730 in a matter of days when the time comes. Most importantly, the price is now not far above all of its principal moving averages, which are bunched closely together and bullishly aligned. This confluence of the price and moving averages signifies a complete unwinding of the overbought position which reached an extreme in April of last year, and is a rare technical situation that invariably leads to a big move, which is expected to be to the upside. 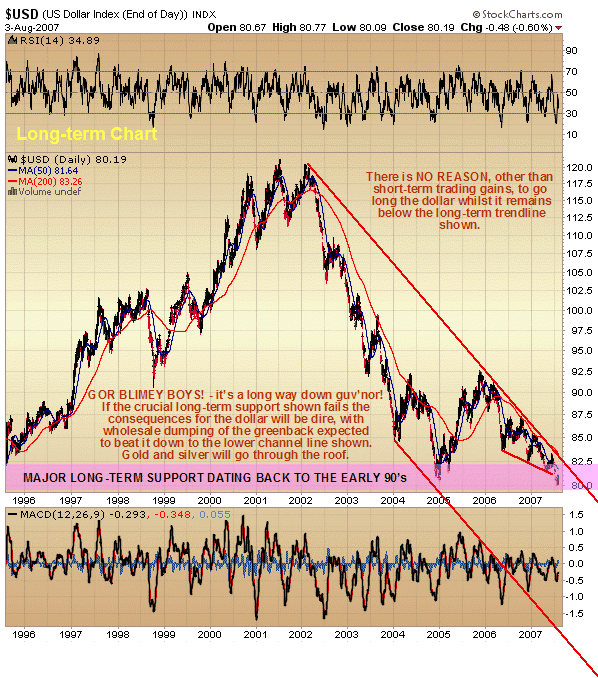 Gold is now expected to break above $730 quite soon, an event which will probably be triggered by the dollar breaking decisively below 80 on its index, which it has been struggling to stay above for several weeks. Some weeks ago it had looked like a bullish Falling Wedge was forming on the dollar chart, dating back to May last year, but it has since broken down from that, and now looks very weak. The PPT (Plunge Protection Team) can be assumed to be fighting tooth and nail to defend the 80 level on the index, which the dollar has already tripped past briefly on a couple of occasions, because failure of this long-term support level can be expected to trigger wholesale dumping of the dollar at which time gold and silver will go through the roof. Our long-term chart which now shows a long-term downtrend channel previously thought to be too pessimistic, borders on apocalyptic. This chart projects the dollar index down to about 60, assuming it drops down to the lower return line - which could easily happen if a lot of big dollar holders decide to bail. 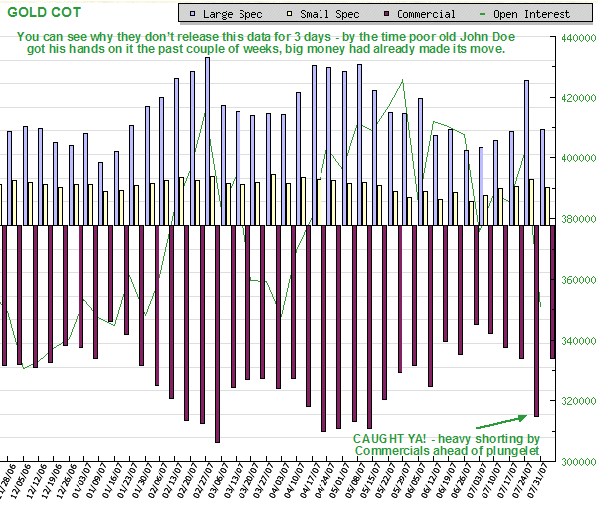 Some readers may find the idea of gold going up at a time when oil is falling - oil is believed to be commencing a substantial intermediate correction - hard to swallow. The explanation for this probable divergence is simple. Gold prices are driven by differing dynamics from oil prices. Oil prices depend on the demand generated by strong economic activity. The US faces a recession, most likely a severe recession, which is likely to have a knock-on effect on many other economies, including the growth economies such as China with which it is intimately entwined. Even if this does not result in a reduction in demand it can be expected to curtail demand growth. This is why oil stocks have been plummeting along with the broad stockmarket, which has raised a red flag for oil prices. Gold on the other hand is expected to take center stage once again in troubled economic times as a safe haven for funds fleeing other sectors, which will include US bonds once investors make the unsavory discovery that these are not a safe haven either and they are obliged to up sticks and move on again. This bullish impetus for gold will be magnified and enhanced by a variety of fundamental factors described in detail by other authors, some of which are unique to our time, such as the derivatives pyramid. Conclusion: gold is a strong buy here and holders should continue to stay long in expectation of a break above $730. Traders should only consider exiting positions for safety on a break below the March low at about $635 - and be prepared to get back in quickly if it breaks back above it. Short positions should continue to be maintained in the US dollar and only closed out or reversed in the event that it breaks above the long-term downtrend line shown on the chart. Further short-term weakness in Precious Metals stocks should be utilized as a late opportunity to accumulate the better issues ahead of what could be a truly massive rally. Silver The bullish arguments relating to silver are this week almost identical to those set out for gold in the Gold Market update, to which readers are referred, and it only remains to highlight the differences. Gold has been outperforming silver all year to date, and although this could change anytime, there is no sign of it yet. A recent example is the fact that gold has broken clear out of the restraining "Distribution Dome" shown on its chart, whereas silver has only managed a marginal breakout above its dome pattern. Also, late last week, gold got close to its July high, which silver did not by a margin. The stronger look of gold at this time is also reflected in its moving averages, which are a little more bullishly aligned than is the case with silver - silver recently dropped below its 200 and 300-day moving averages which gold did not. 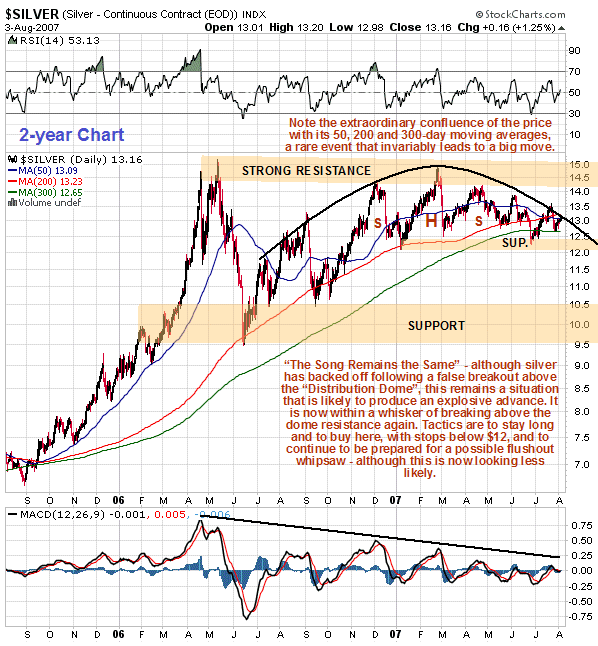 The differences just outlined are trivial, however, when one steps back and considers the big picture, which is that both charts are looking very bullish - and both metals are set to soar if the dollar goes ahead and does what it has been threatening to do for some time, which is break clear below 80 on its index, an event that is expected to trigger a tidal wave of dollar liquidation. If this happens as expected, then silver, like gold, is expected to quickly take out its highs of last year and to continue higher in a vigorous uptrend. Aug 6, 2007 Clive Maund
is an English technical analyst, holding a diploma from the Society
of Technical Analysts, Cambridge, England. He lives in Chile. Copyright ©2003-2011 CliveMaund. All Rights Reserved. Charts courtesy of StockCharts.com. 321gold Ltd |
