|
|||
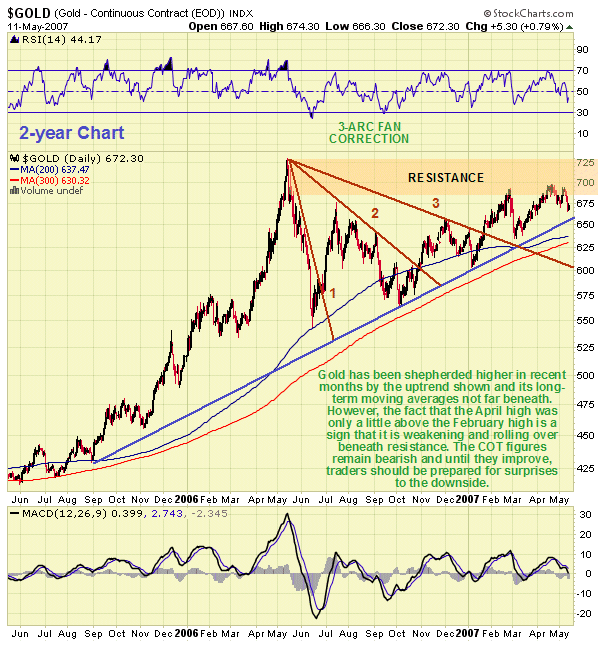
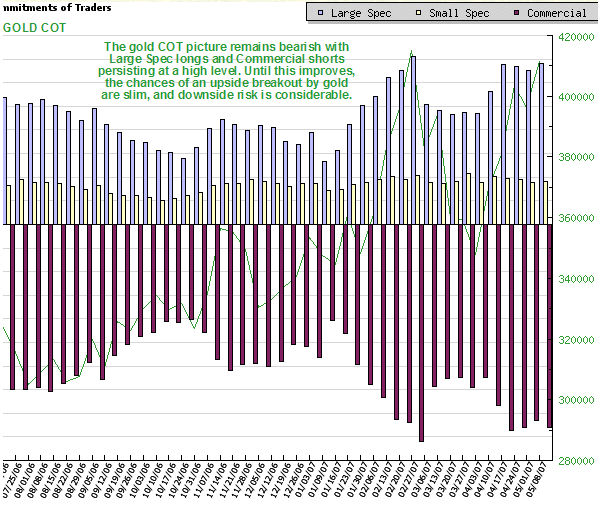
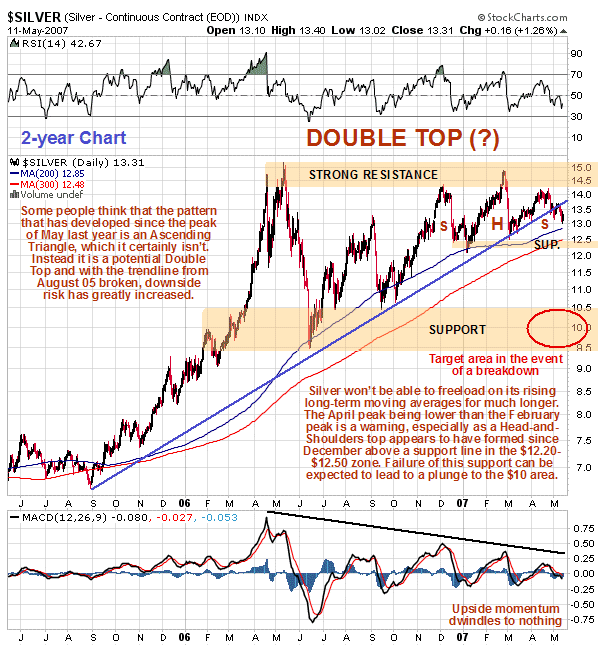
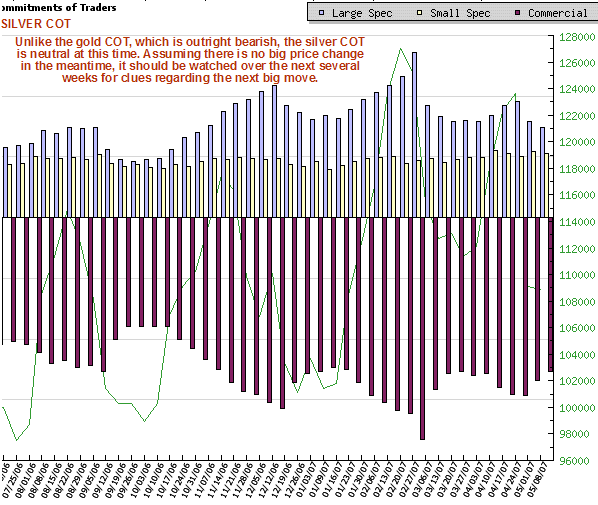
Gold & Silver Market UpdatesClive Maund Gold In the last update, published on or after 16th April, we expected gold to drop back from the $690 area due to the bearish COT structure, and that is what has happened. The latest COTs are not good news for bulls, with the Commercial shorts still at a high level - high enough to preclude a significant advance in the near future, and to maintain the risk of a substantial decline.  On the 2-year chart we can see how gold is being shepherded higher by its long-term 200 and 300-day moving averages, but as it lacks the oomph to get on with it and break out above last year's highs around $730, it is now rolling over and being forced into an increasingly confined space between the trendline shown, or at least the moving averages, and the overhead resistance at and towards $730. The situation is clearly becoming increasingly tight which must force a breakout one way or the other soon, and sadly for the bulls, the latest COT figures show that the risk right now - or as of 3 days ago, as the COT figures are released 3 days late in order to give big money and insiders the edge - is to the downside, notwithstanding any brief rally. The fact that the April high was only a little above the February high is also a sign of weakness. What we will need to see in coming weeks, or over the next month or two, as a prerequisite for a gold breakout above $730, is a significant improvement in the COT picture, with a much lower Large Spec long and Commercial short position. In the meantime, traders should be prepared for surprises to the downside. If gold does break below first the trendline and then its long-term moving averages, it will at best lead to a large extended trading range developing between the strong support in the $550 - $570 area and the resistance at last year's highs around $730. At worst it will mean that a Double Top has formed and the bull market is over.  The COT chart shows the extent of the Commercial short position and the Large Spec long position that are thought to be at a level that will prohibit any significant advance in the near future while at the same time making downside risk considerable. Traders should orient themselves accordingly. Enrico Orlandini, in an article published recently on the 3rd May, made the following observation about the Commercials: "What I'm trying to say here is that people buy gold for the wrong reasons. If your reasoning is wrong, then it's almost a sure bet your timing will be wrong. Enter the Commercials: very large, sophisticated, smart, unemotional traders who make their living off of people with faulty reasoning. And they've got it down to a science. They suck you in, clean you out, and send you home packing and a lot poorer for the experience." The writer understands that the foregoing makes fairly depressing reading for gold and gold stock bulls, but does this mean you should fold your tent and call it a day? Unless you insist on buying great lumpen stocks that slavishly follow the indices, the answer is definitely not! Over on www.clivemaund.com we haven't been letting the grass grow under our feet, there are always opportunities out there and we have recently made substantial gains in stocks such as Bactech Mining, Baja Mining, Bonaventure, Golden Phoenix, Industrial Minerals, Silvermex Resources, Sundance Resources, United Bolero, Vangold Readers are invited to compare the prices now with those when these stocks were recently recommended. Silver The silver chart should strike fear into the hearts of silver investors. There is no Ascending Triangle on the chart (from last May's highs), as some claim, instead the pattern is looking more and more like a large Double Top, with the second peak taking the form of a Head-and-Shoulders top. Before anyone graciously goes to the trouble of enlightening the writer about the wonderful fundamentals for silver, let me say this - don't bother, I know about them - and so does the market, that's the trouble, they may already be fully discounted by the market.  We can see this ominous looking pattern in detail and in its entirety on the 2-year chart. When silver peaked in May last year, it had become extremely overbought, having opened up an enormous gap with its 50 and 200-day moving averages. This led to it plunging unceremoniously back to the vicinity of its 200-day moving average. After that a more gradual uptrend became established, with silver riding above its long-term moving averages, the 200-day and 300-day shown on our chart, the advance starting to run out of steam as the price approached last year's highs. In recent months upside momentum has ebbed away steadily to the point that there is now none, as shown clearly by the descending series of peaks on the MACD indicator at the bottom of the chart, as a bearish Head-and-Shoulders top has formed that comprises the 2nd peak of the large Double Top formation. What should be a disturbing development for silver bulls is the recent failure of the long-term uptrend line in force since August 2005. The parallel uptrend in gold has not yet failed. Now, all that stands in the way of a potentially dramatic plunge back to strong support in the $10 area is the important support in the vicinity of the 200 and 300-day moving averages close by beneath, and a line of significant support marking the lower boundary of the Head-and-Shoulders top in the $12.20 - $12.50 zone.  The COT chart for silver is neutral to slightly bearish - a lot less bearish then the gold COT chart, and this difference may reflect silver's recent underperformance relative to gold, and allow scope for a rally of sorts from the current somewhat oversold condition arising from the recent drop. Not that this would be regarded as cause for celebration. Assuming nothing dramatic happens in the meantime, which is perhaps taking a liberty, we should keep a close watch on the COT chart in coming weeks to see if Large Spec long positions and Commercial short positions increase significantly, which would signal an increasing risk of a drop, or whether they moderate significantly, thus creating upside potential. With the Precious Metals sector starting to weaken rapidly, the next thing we will be looking at on the site is defensive strategies with reference to the HUI index and individual stocks and options. May 14, 2007 Clive Maund
is an English technical analyst, holding a diploma from the Society
of Technical Analysts, Cambridge, England. He lives in Chile. Copyright ©2003-2011 CliveMaund. All Rights Reserved. Charts courtesy of StockCharts.com. |
