|
|||
The Looming Treasury Bond Massacre...Clive Maund Like frightened rabbits scurrying back to the apparent safety of their hutches, investors rattled by the sub-prime shocks and the associated tremors in stockmarkets have been fleeing to the perceived safety of Treasury Bonds and Notes. The bad news is that this time the poacher knows where the rabbits are hiding and rabbit stew is on the menu tonight. Let's just stop and think about this for a moment - just what is a Treasury Bond? - it is a piece of paper telling you that you are going to receive a fixed sum of US dollars at some designated point in the future. In the meantime you are going to receive interest, called a coupon, at a variable rate that depends on how the price of the bond fluctuates during the intervening years until redemption. Given the outlook for inflation, interest rates, the US economy and the US dollar, US bonds must rank among the least attractive investments on earth. Buyers or holders of US bonds at this point are making a number of erroneous and dangerous assumptions - including that interest rates and inflation will remain within reasonable bounds and that the US dollar will retain a reasonably high percentage of its value during the life of the bond. As we know the Fed has lowered short-term rates as an emergency measure, and immediately the crisis ends - and even if it doesn't, it will raise them again. The official inflation statistics are highly misleading - real world inflation is much higher than government figures and is increasing rapidly. The outlook for the US dollar remains dire. Thus the downside risk for bonds is very considerable, and it is likely to be made a lot worse by the fact that investors are going to start demanding much higher returns for the growing risks involved in being a lender. We will now look at the charts for Treasury Bonds and Treasury Bills, starting with the 1-year chart for the 30-year T Bond. At first glance things look fairly rosy on all the charts presented here. On the 1-year chart for the 30-year T Bond we can see that it remains in an uptrend that has been in force from the low of last June. However, on closer inspection we can also see definite signs of deterioration in the recent past. In the first place, a 5-wave sequence has been completed since last June, which is normally followed, as a minimum, by a 3-wave reaction that breaks the price well below the main uptrend channel. Another important point to observe is that each successive up wave has become steeper with the last one, wave 5, ending with a throwover breakout Island Top, signaling exhaustion of the uptrend. In addition to marking the end of the 5th wave of the series, this Island Top is also thought to mark the end of the uptrend in force from last June, for the reasons just given above. Still another point to observe is the fact that the wave 5 advance did not succeed in taking prices comfortably clear of the wave 3 peak, and the support in the vicinity of that peak is already being severely tested and looks set to fail shortly. The now large gap between the 50 and 200-day moving averages is another factor suggesting that the time is at hand for a change of trend. It doesn't take a great effort of imagination for holders of T Bonds here to join the dots and come to a conclusion about what to do them, especially given the current comparatively good prices on offer, which are not expected to last much longer. On the long-term chart for the 30-year T Bond it is interesting to observe that it is still close to its all time highs - all the more reason to get rid of it given the dire outlook. Although close to its highs, we can see that it has, in fact, been weakening for a long time, with a bearish Rising Wedge gradually giving way to a rectangular trading range in recent years, following a breach of the important uptrend line. With prices up at the top of the trading range it is clearly a good place to offload them. Looking at this chart it is hard to envisage the severe bear market that surely lies ahead which will trash the prices of all US Treasuries. 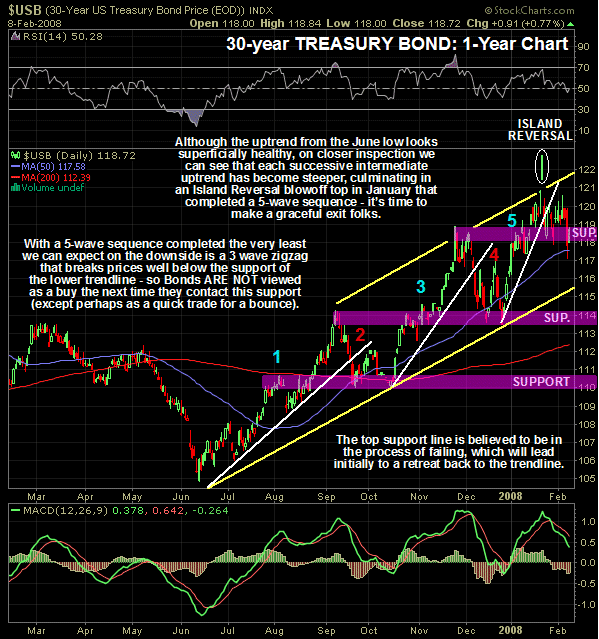 We will look now at the 10-year Treasury Note. As we will see there is not a lot of difference between the charts for Bonds and the charts for Notes, although Notes currently look stronger. 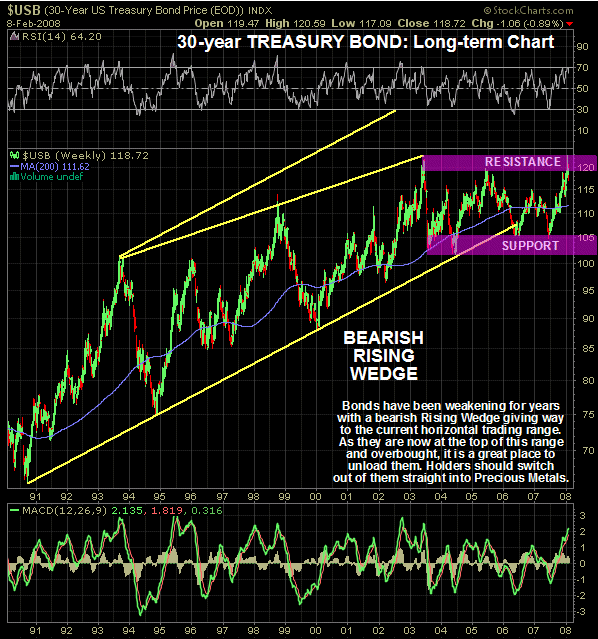 On the 1-year chart for the 10-year T Note the picture is much the same as that for the 30-year T Bond, with both having completed a 5 wave sequence, and an Island Reversal also appearing on the Note chart in January. The most noticeable difference is the stronger 5th wave on the Note chart that took it well clear of the 3rd wave peak and thus far it has not reacted back much following this up wave, so that it is still way above its first support level, unlike Bonds which did not clear the 3rd wave peak by much and are already down on their 1st support level. So, Notes are stronger than Bonds at this point, but that won't help them much as the Island Reversal on both charts signals that they will both go down in unison. 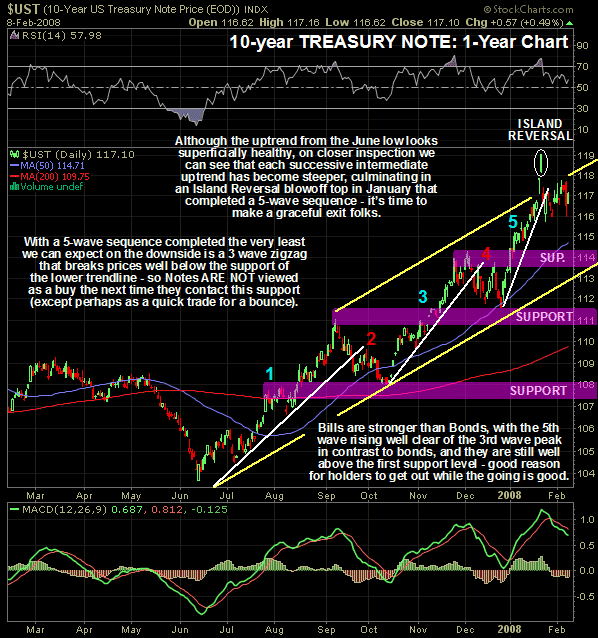 The long-term 10-year T Note chart does not go back as far as the long-term Bond chart above. On this chart we can see how the large bullish Falling Wedge between 2003 and mid-2007 predicated a new uptrend, and we have seen a strong uptrend develop as "funk money" has fled to the Treasury market as a perceived safe haven. However, the steep uptrend is now believed to have run its course, with the Island Top in the middle of the important resistance level towards the 2003 high, that can just be made out on this chart, looking like the uptrend's last gasp. The overbought status at that point is made clear by the MACD indicator at the bottom of the chart. Even though it looks on this chart as if we could see a little more upside short-term, or the development of a high trading range before it goes lower, it looks set to react soon on this 1-year chart, without any further significant progress. 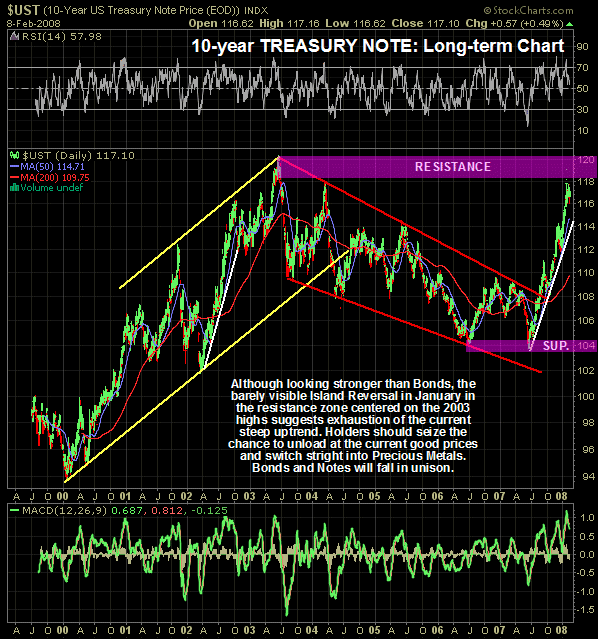 If your objective is capital appreciation or simply to obtain a reasonable return on capital employed it is very hard to make a case for owning US Treasuries - on the contrary there is a compelling case for avoiding them or getting rid of them. Fundamentally the outlook is dire - the US economy is weakening at an alarming rate - the country is technically bankrupt and running such massive deficits that it makes bankruptcy in the normal sense of the word look tame. Short-term interest rates are being held at an artificially low level by the Fed and that must end, meanwhile long-term rates are rising sharply. Inflation in the US is high and rising, and it is grossly understated by official statistics. The dollar continues to be debased at a breathtaking pace and renewed severe decline appears to be inevitable, despite the enthusiastic efforts of other countries and trading blocs to emulate the US by debasing their own currencies. Technically, as we have seen, the recent strong uptrend in Treasuries appears to have run its course and the prospect is for a retreat that could easily accelerate into a savage and severe bear market. Given the unprecedented dangers to the world financial system at this time, US Treasuries could easily end up priced at a mere fraction of their current values. Could this analysis be confounded by Treasuries breaking above the strong resistance at their 2003 highs and accelerating into an even steeper parabolic spike? - of course it could - anything is possible in markets. However, such a development looks highly unlikely at this point, and traders taking positions in anticipation of the Treasury uptrend breaking down can guard against an upside breakout and spike by the simple expedient of placing stops above the 2003 highs. There is an article doing the rounds that makes the argument that with the election season powering up in the US, the elites will order the press to support the dollar at every turn and "gin up" the economy, and also surmises that the G7 ministers have decided that competitive devaluation against the dollar is getting them nowhere, and they will therefore turn on gold instead, this being the underlying reason for the IMF announcing that it will sell some of its gold reserves. This combined with a drop in demand for gold from China and India will conspire to ensure a seasonal drop in the gold price from now on until August, it also presupposes. In addition it claims that the Saudi's will likely help out their old friend George by dropping the oil price over the Summer ahead of the election. This article makes a lot of assumptions, not the least of which is that the elites maintain complete control over the economy, major financial institutions, the press and even the mindset of international investors, when the events of the past 6 months have clearly demonstrated that they have lost control. The elites have, with their market deregulation and financial engineering, bred an enormous Godzilla like monster which, having eaten its fill, has bust out of it pen and is on the rampage, and it is actually rather amusing to watch its former masters running after it in a futile effort to regain control, whilst at the same time trying to fool the world at large that they still have any semblance of control. The article also overlooks the fact that the same Plutocratic elites control both the Democratic and Republican parties - the election is nothing but a pantomime performed to maintain the illusion of democracy for the masses - every single second you spend watching electioneering in the US is a second of your life wasted. It is of course flattering to gold that the G7 ministers should think that depressing its price is an alternative to the path of competitive devaluation against the dollar, the only trouble is that the notion is absurd - a rising gold price may bear witness to the incompetence of their policies, but since when was incompetence in high places an insuperable problem. So what if the gold price rises? Sometimes you have to be cruel to be kind. While Treasuries have undeniably made impressive gains over the past 8 months, anyone continuing to hold them forthwith given the now appalling and worsening fundamental outlook and the recent technical deterioration must be classed as a fool. The only exception being those elements on Wall St and elsewhere who are intentionally misallocating the resources of others into Treasuries for abstruse reasons. Feb 12, 2008 Clive Maund
is an English technical analyst, holding a diploma from the Society
of Technical Analysts, Cambridge, England. He lives in Chile. Copyright ©2003-2011 CliveMaund. All Rights Reserved. Charts courtesy of StockCharts.com. 321gold Ltd |
