 The Worst Investment
of All Time? The Worst Investment
of All Time?
Paul Learton
May 27, 2009
One investment, more than any
other, has proven to be a terrible storehouse of value for well
over 80 years.
While some disasters unfold
rapidly (Enron, subprime mortgages, etc.), this investment's
decline has occurred in slow motion, losing an average of 3.6%
a year. Indeed, you can hardly find a period in the last 89 years
in which this investment actually MADE money.
That investment is the dollar.
source: Zero
Hedge
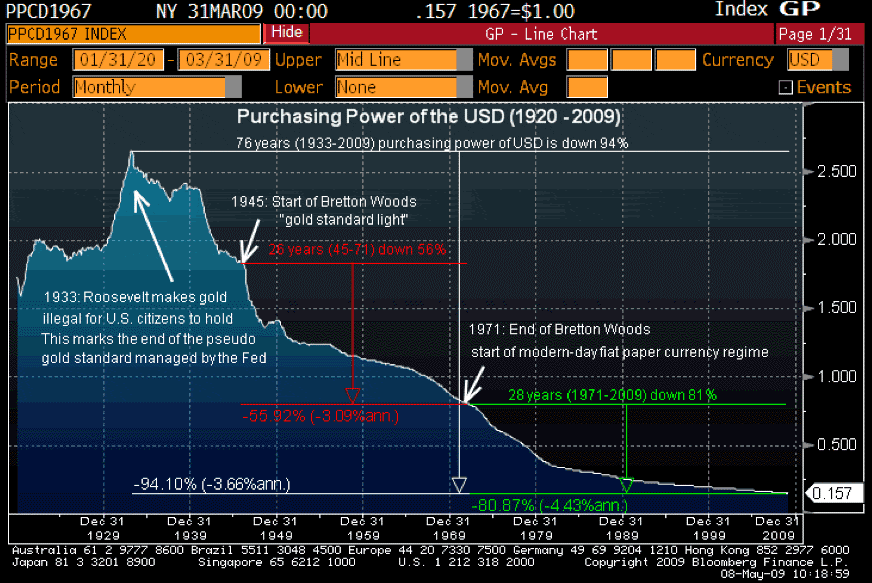
The above chart shows the history
of the dollar's purchasing power going back to the 1920s. All
told the dollar has lost 94% of its purchasing power since we
abandoned the gold standard. The most dramatic loss in purchasing
power occurred directly after Roosevelt made it illegal to own
gold. However, with few exceptions, the dollar has been spiraling
downward ever since 1920.
After Nixon ended Bretton Woods
(legislation that pegged the dollar to gold indirectly), the
pace of purchasing power destruction accelerated with the dollar
losing an average of 4.4% in purchasing power annually.
Gold and the Dollar have maintained
an inverse relationship ever since this time. One zigs, the other
zags. One rallies, the other falls. And starting in 2000, both
entered long-term trends: the dollar falling while gold rallied
(see the below chart).
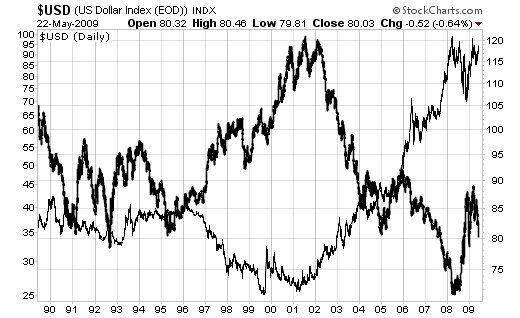
Now, nothing ever goes straight
up OR straight down. And starting in June 2008, the dollar erupted
in its strongest rally in decades, jumping 22% in eight months.
The story here was easy to understand, although most of the media
ignored it. With the dollar continually in decline and interest
rates well below the rate of inflation in the post-Tech Crash,
foreign corporations and institutional investors borrowed heavily
in dollars.
Doing this meant their debts
were continually shrinking relative to their profits (sales were
denominated in a currency that was rising relative to the currency
in which their debts were denominated). This means their debts
were easier to pay off.
However, when the dollar started
a rally in July '08, this positioning began going horribly wrong.
Anyone short the dollar got killed and had to cover their shorts
(buy dollars) which in turn pushed the dollar higher. At one
point there were an estimated $9 trillion in dollar shorts in
the world. So the dollar rally was the mother of all short squeezes.
And as you can see, it kicked gold in the teeth.
However, with the Feds running
the printing presses and inflationary concerns hitting the market
(oil and most industrial commodities have soared in the last
three months), the dollar's rise may have come to an end. If
the dollar breaks below 79 in a meaningful way, it's "look
out below" time. Which should put gold above $1,000 in a
sustainable way.
I wrote last week that based
on the historic trends in the last gold bull market (1970-80)
I expected gold to begin its next leg up this fall. However,
looking at the dollar vs. gold chart above, it may already be
happening. Watch these two investments closely. We may be on
the verge of a truly seismic shift between the gold and the dollar.
***
Paul Learton
email: paul.learton@gmail.com
Paul Learton: Paul is Chief
Investment Strategist for OmniSans Research, an independent financial
research firm based in Charlottesville, VA.
Paul focuses
exclusively on timing major trends between asset classes and financial
markets. He's not looking for temporary bottoms or momentum
plays, rather, he's looking for seismic shifts in capital flows
and consumer behavior, measuring profits and market moves
in terms of years if not decades. Paul's long-term horizon
and voluminous knowledge of historic trends and economic data
shape all of OmniSans Research's investment strategies.
Previously Paul
worked as a wealth manager for several private clients.
321gold Ltd

|