| |||
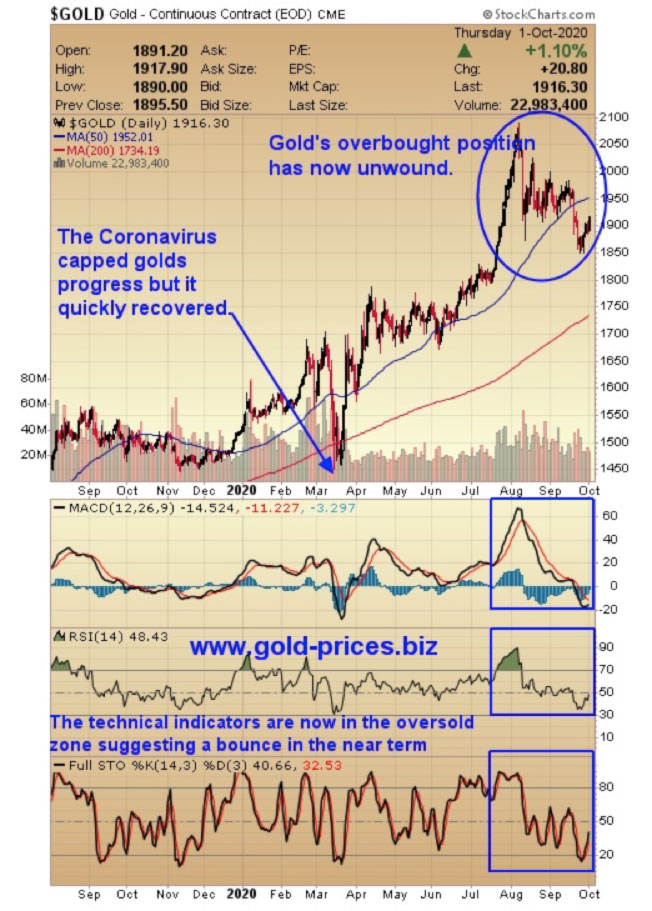
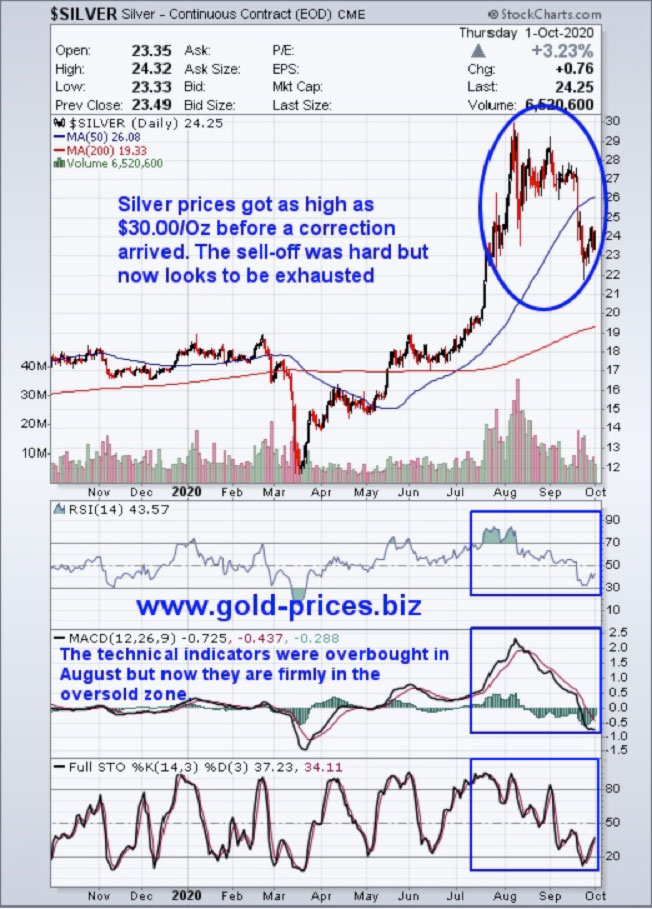
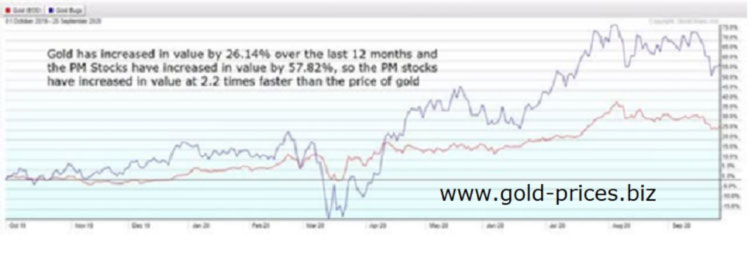
Gold And Silver Stocks Correction Almost Exhausted, Time To BuyBob Kirtley Introduction Today, we will take a look at the damage inflicted on this sector by the recent sell-off and try to ascertain just what lies ahead for the precious metals stocks involved in gold and silver mining. We will commence with a look at the charts for gold and silver prices followed by a comparison of gold’s progress versus that of the Gold Bugs Index (HUI) and conclude with what lies in store for the Precious Metals stocks in the medium-term. The 12-Month Gold Chart The Coronavirus capped golds progress early this year, however, it recovered quickly to trade at higher levels than before this nasty virus struck. The technical indicators, the RSI, MACD and the STO are now in the oversold zone suggesting a near-term bounce is on the cards and that this correction has run its course. Those investors that rely purely on chart analysis will see this set up as an opportunity to acquire gold at a discount to what gold was a few months ago and venture back into this market sector with the view to acquiring a bargain. (Click on images to enlarge) The 12-Month Silver Chart The technical indicators were overbought in August, however, as the chart below indicates they are now firmly in the oversold zone due to the price of silver falling approximately $5.00/Oz in a few short months. Silver is now positioned below its 50dma and above its 200dma which suggests that there is plenty of room to move higher. It should also be noted that both of these moving averages are heading north which I view as a positive indicator as they suggest that there is support for silver going forward. A Comparison Chart Of Gold And The Precious Metals Stocks What we can glean from the chart below is that gold has increased in value by 26.14% over the last 12 months and the PM Stocks have increased in value by 57.82%, so the PM stocks have increased at a speed which is 2.2 times faster than the price of gold The Gold Bugs Index: The HUI The chart below shows that the HUI may have found a base at 320, however, these are volatile times and wild fluctuations are to be expected. The technical indicators on the chart below are now a tad oversold so we could get a bounce from this point. It should also be noted that that Q2 has just ended which coincides with the Quarterly Options trades expiring on 30th September 2020. The price of gold can be volatile in the lead-up to this expiry date as traders try to position themselves to generate a profit from such price oscillations. Conclusion A visual inspection of the above charts suggest that the PM stocks have not suffered as badly as they could have done, which is a sign of their underlying strength. Gold and silver have been sold-off hard in a correction that was warranted. However, they are both now positioned to consolidate and form a new base in preparation of a resumption of this Bull Market. Central Banks continue to print money at an unprecedented speed in turn they are diluting the value of their currencies and so investors will rotate out of currencies and into a form of hard assets. My preferred hard asset is gold; however, some investors prefer Land and Property as an alternative investment, a subject I will leave for better informed writers than myself, but nevertheless worthy of your consideration. In Q3 gold was on average about $190/Oz more expensive that it was in Q2 so this next round of financial results should be sparkling and give the PM stocks a real boost. During this dip I did managed to acquire one stock that has been on my Watch List for some time and I am actively searching for the next bargain to add to my portfolio of PM stocks. For the record, I am long physical gold and silver and own around 19 open positions in this sector, including Wheaton Precious Metals Corp. (WPM) SSR Mining Inc. (SSRM), Kirkland Lake Gold Ltd. (KL) and Sandstorm Gold Ltd. (SAND). I am of course biased towards this sector of the market so please do your own due diligence. ### Bob Kirtley Disclaimer: www.gold-prices.biz or www.skoptionstrading.com makes no guarantee or warranty on the accuracy or completeness of the data provided. Nothing contained herein is intended or shall be deemed to be investment advice, implied or otherwise. This letter represents our views and replicates trades that we are making but nothing more than that. Always consult your registered adviser to assist you with your investments. We accept no liability for any loss arising from the use of the data contained on this letter. Options contain a high level of risk that may result in the loss of part or all invested capital and therefore are suitable for experienced and professional investors and traders only. Past performance is neither a guide nor guarantee of future success. 321gold Ltd |