Investment Scoring & Timing
Newsletter
Investing Simplified -
Part II
Spot The Obvious First
Michael Kilbach
Sep 28, 2007
When you build a puzzle do
you dump out 1000 pieces and randomly try to put together the
picture, or do you look for the obvious corners, flat borders,
build the frame and then fill in the details? So why do investors
try to match a million random pieces of information in an attempt
to try to build a clear picture?
There is a lot of misleading
information in the world of economics and investing. With all
of the varied components, such as flawed theories and strategies,
potential conflict of interest among advisers, potential conflict
of interest within government, various opinions, countless indicators
and different interpretations of them etc., it can be very difficult
to see the forest through the trees. But some things are
much easier to understand and interpret than others. It is this
understanding that helps us focus on our simple investment strategy
in order to try and outperform the markets with more consistent,
profitable trades.
Some of the very complex elements
of investing are just too difficult to predict. For example,
how good have economists been at predicting when the US consumer
will be "tapped out"? How many times have you heard
that prediction made inaccurately? If we based our investment
decisions solely on a complex indicator such as US consumer spending,
I think we would be broke.
But doesn't a good investor
have to untangle and make sense of the web of data, indicators
and press releases to be successful? Isn't this the only way?
We believe following various indicators can help confirm or not
confirm our position but we do not try to sift through thousands
of moving parts to draw our conclusion. Instead, we make a hypothesis
based on some obvious signals and work backwards. Let me
explain.
We believe the world is so
fixated on looking at the same indicators, and trying to follow
each others actions. ...we get lost trying to interpret
those signals. How can everyone follow the same news stories,
standard indicators and strategies and then expect to outperform
the competing investors who are doing the same things? For example,
if every investor is watching what the Federal Reserve will do
with interest rates on Tuesday September 18, 2007 as their unique
insight to the market, how does that help anyone get ahead?
A handful of years ago we could
not tell you when housing prices would fall, when oil would hit
$80 per barrel or higher, when the US dollar would break below
0.80, when the Canadian dollar would hit parity with the US dollar,
when silver would hit $13 and so on. What we could tell you is
this:
Based on historical records,
relative to other investments such as the US stock market, Precious
Metals Investments were highly undervalued.
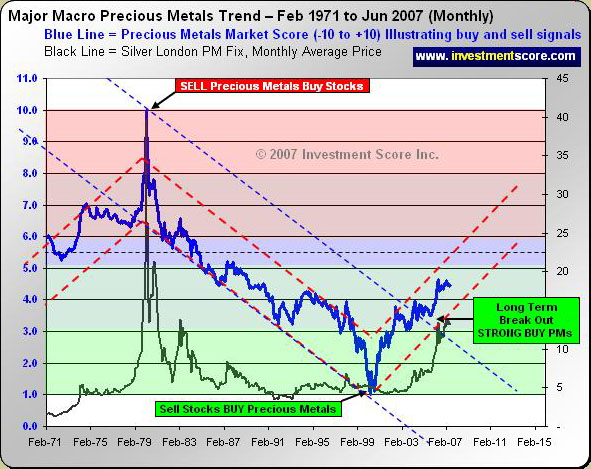
(I will explain more
on the above chart in a moment.)
This was all we had to know
and from there we worked backwards to confirm or deny our hypothesis.
From this starting point, every piece of data or news became
an opportunity to confirm or challenge our investment decision.
You may be wondering; how did
we determine Precious Metals were undervalued relative to other
investments? Think of it this way. Is a dollar a good measure
of your investments? We know that a dollar is regularly losing
purchasing power over time. For example, since 1970 each US dollar
will buy a smaller house, less gas for a car, less labor from
an employee, less food, less entertainment, less energy for your
home etc. Therefore we think a dollar is a poor measuring stick
for our investments. We are more interested in knowing how much
of one investment we can buy with the proceeds of another investment.
In other words, we compare investments directly to one another,
such as how much Dow Jones will my Silver buy.
The above chart is a custom
built long term chart comparing precious metals such as silver
and gold directly to US stocks. There are two important elements
of this chart:
1) Relative Value: When
the blue line is near the top of the chart in the red area with
a score near the +10 level, it would take a smaller quantity
of precious metals to buy a larger quantity of stocks and therefore
it would be wise to sell some metal to buy some stocks. When
the blue line is in the lower green portion of the chart with
a score near +1 it would be wise to sell some stocks and buy
some precious metals. As you can see from the grey line, the
price of silver was very expensive in 1980 and relatively speaking
very inexpensive in around 2000.
2) Trend: This chart
also helps us visually see if metals appear to be gaining in
value relative to stocks (eg. Blue line trending up 1971 - 1980),
or stocks appear to be gaining in value relative to precious
metals (eg. Blue line trending down 1980 - 2000).
As you can see, since 2000
it appears that precious metals have been aggressively heading
higher relative to US stock markets. It also appears the trend
is well in place and precious metals still seem to be undervalued
to stocks when we compare a historical measure such as 1980.
Also notice that the blue line was much higher in 1980 and like
a pendulum swinging we expect the blue line to reach a level
similar to this height again. Therefore this chart is very useful
in helping us determine not only when to add to our metal investments,
but also how aggressively we may wish to do so and when we should
exit our positions.
So now that we have determined
that silver and gold may be undervalued relative to other investment
options, we filter and interpret other indicators differently
than had we not noticed this major development. The popular media,
Wall Street, US government etc. may not want you to sell your
US dollar denominated investments such as US stocks in order
to buy precious metals. These institutions may promote stocks,
incorrectly justify what is happening with inflation, volatility,
liquidity, interest rates etc. and confuse the public about their
investment decisions because they may have a vested interest
to do so. But some things are just too hard to hide. It is hard
to hide the fact that back in 2000 it took far less stocks to
buy a large amount of precious metals. At that time precious
metals were obviously undervalued relative to stocks.
With this theory we now have
the foundation for our belief. We then use indicators such as
supply and demand, rising consumer prices, rising oil prices
etc. to help confirm or challenge our belief. We can not tell
you exactly when the US dollar will head lower or when the Dow
Jones will correct in nominal value but we can tell you that
we expect those things to happen. We believe this will help verify
our hypothesis that silver and gold are undervalued relative
to the general stock market.
Basically we believe most people
try to make sense out of an inundating amount of different signals
to decide what to do with their investments. In the process we
think they become lost and misled by the overwhelming amount
of random information available for consideration at different
times. Instead, we look for the simplest, most obvious signs
to decide what to do with our investments, and then we further
filter through the host of different signals to confirm or challenge
our decision. We find this process very effective in keeping
our investment decisions less emotional and more profitable.
If you would like to learn
more about our system and view updated versions of the chart
above, I invite you to visit our website at www.investmentscore.com.
[FYI:
Investing Simplified - Part I is
here]
Sep 27, 2007
Michael Kilbach
email: mkilbach&investmentscore.com
website: www.investmentscore.com
 Disclaimer/Disclosure: Disclaimer/Disclosure:
No content
provided as part of the Investment Score Inc. information constitutes
a recommendation that any particular security, portfolio of securities,
transaction or investment strategy is suitable for any specific
person. None of the information providers, including the staff
of Investment Score Inc. or their affiliates will advise you personally
concerning the nature, potential, value or suitability or any
particular security, portfolio of securities, transaction, investment
strategy or other matter. Investment Score Inc. its officers,
directors, employees, affiliates, suppliers, advertisers and agents
may or may not own precious metals investments at any given time.
To the extent any of the content published as part of the Investment
Score Inc. information may be deemed to be investment advice,
such information is impersonal and not tailored to the investment
needs of any specific person. Investment Score Inc. does not claim
any of the information provided is complete, absolute and/or exact.
Investment Score
Inc. its officers, directors, employees, affiliates, suppliers,
advertisers and agents are not qualified investment advisers.
It is recommended investors conduct their own due diligence on
any investment including seeking professional advice from a certified
investment adviser before entering into any transaction. The performance
data is supplied by sources believed to be reliable, that the
calculations herein are made using such data, and that such calculations
are not guaranteed by these sources, the information providers,
or any other person or entity, and may not be complete. From time
to time, reference may be made in our information materials to
prior articles and opinions we have provided. These references
may be selective, may reference only a portion of an article or
recommendation, and are likely not to be current. As markets change
continuously, previously provided information and data may no
be current and should not be relied upon.
321gold Ltd

|
