Investment Scoring & Timing
Newsletter
What's Going On In PMs?
Michael Kilbach
Jun 28, 2007
The past few days of trading
in gold and silver are a great example of why we continually
stress the importance of keeping the big picture in perspective.
It is difficult not to become emotional when dramatic one day
drops catch even the most seasoned investors off guard.
In the short term, strong dramatic
price drops strike fear and doubt into our trading decisions.
In these situations we are likely to sell out of our well considered
investments and bury our heads in the sand as we can not bear
to watch. Remember, if trading the financial markets was easy,
everyone would be home building wealth and nobody would be working.
In this article we will show
a series of charts that may help put some perspective on the
recent price action in silver and gold.
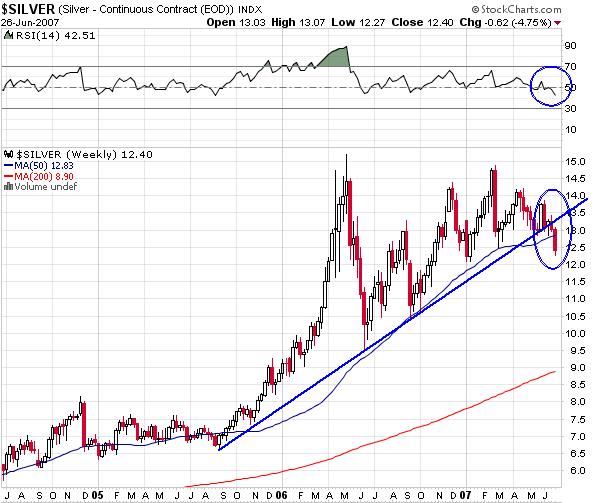
The following is the three
year weekly chart of silver ending June 26, 2007:
 (Chart courtesy
of StockCharts.com)
(Chart courtesy
of StockCharts.com)
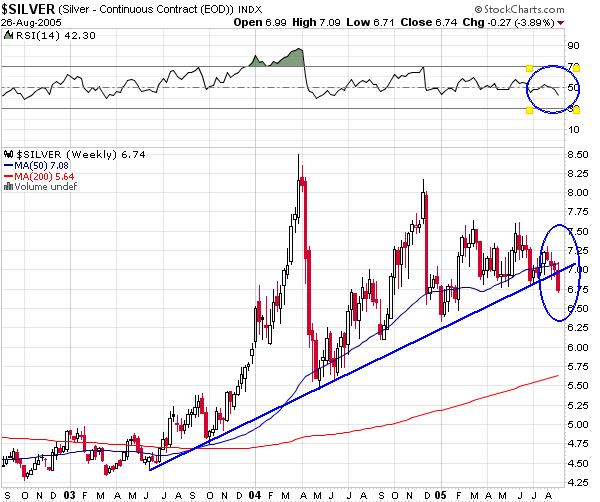
Does this next chart look
familiar? (Please carefully
compare the two charts)
Below is a three year chart
of the weekly price of silver ending August 26, 2005.
 (Chart courtesy
of StockCharts.com)
(Chart courtesy
of StockCharts.com)
You will notice the following
similarities in both charts above:
1) A major price advance, correction
and consolidation climbing on a strong trend line (blue line).
a
2) After many months of consolidation, an aggressive price drop
(blue oval) below the blue uptrend line.
a
3) The RSI (top blue circle) breaking below 50.
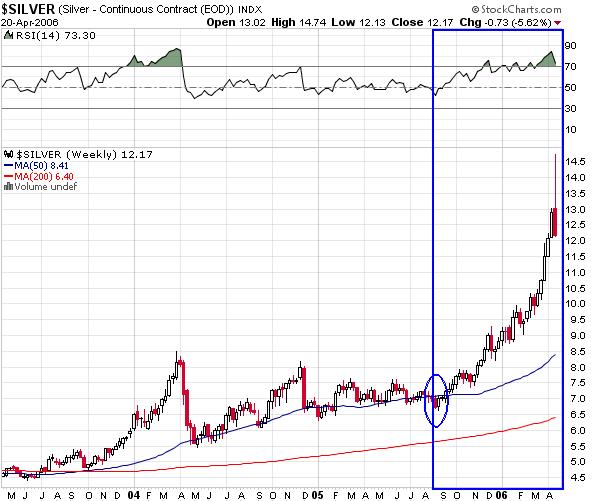
Please note what happened to
the price of silver by April 20, 2006 in the following chart:
 (Chart courtesy
of StockCharts.com)
(Chart courtesy
of StockCharts.com)
Above is a three year chart
of the weekly price of silver ending April 20, 2006.
In the above chart you will
notice:
1) The dramatic short term
correction in August 2005 outlined by the blue oval.
a
2) After a few more weeks of sideways trading action a major
price advance followed (outlined in blue box).
The above similarities between
August 2005 and June 2007 are remarkable but it does not necessarily
mean the same result will transpire. However, this observation
does help put into perspective the potential deception of short
term market movements. The shocking one day drop in the price
of silver and gold on June 26, 2007 may not be as abnormal as
it first appears. Following short term trends sometimes results
in investors forgetting the bigger, more important picture.
In the big picture, does gold
still appear to be in a long term trend? Does Silver still appear
to be in a long term trend? Are precious metals over valued relative
to other investments? Do we see a massive surplus of silver,
base metals, and other commodities inventories? In the big picture
could this possibly be a relatively low risk buy point?
We certainly do not mean to
imply that we know for certain exactly what will transpire in
precious metals in the coming days or weeks. Short term movements
are very difficult to predict. We are in a seasonally weak time
for precious metals and the price of bullion as well as mining
shares could easily head lower. Caution is warranted but when
we keep these short term movements in perspective it is easier
to keep our emotions and trading decisions under control. We
do not plan to sell what we believe are our undervalued positions
but instead we will be looking for buying opportunities in precious
metals investments. If we are lucky we may even be able to buy
at lower prices.
If you found this article useful
please watch for our soon to be released "When Is It Time
To Worry?" article on this website. You may also subscribe
to our free newsletter at www.investmentscore.com. Finally, stop
by and check out our unique custom timing charts and investing
system when visiting www.invesmentscore.com.
Jun 28, 2007
Michael Kilbach
email: mkilbach&investmentscore.com
website: www.investmentscore.com
 Disclaimer/Disclosure: Disclaimer/Disclosure:
No content
provided as part of the Investment Score Inc. information constitutes
a recommendation that any particular security, portfolio of securities,
transaction or investment strategy is suitable for any specific
person. None of the information providers, including the staff
of Investment Score Inc. or their affiliates will advise you personally
concerning the nature, potential, value or suitability or any
particular security, portfolio of securities, transaction, investment
strategy or other matter. Investment Score Inc. its officers,
directors, employees, affiliates, suppliers, advertisers and agents
may or may not own precious metals investments at any given time.
To the extent any of the content published as part of the Investment
Score Inc. information may be deemed to be investment advice,
such information is impersonal and not tailored to the investment
needs of any specific person. Investment Score Inc. does not claim
any of the information provided is complete, absolute and/or exact.
Investment Score
Inc. its officers, directors, employees, affiliates, suppliers,
advertisers and agents are not qualified investment advisers.
It is recommended investors conduct their own due diligence on
any investment including seeking professional advice from a certified
investment adviser before entering into any transaction. The performance
data is supplied by sources believed to be reliable, that the
calculations herein are made using such data, and that such calculations
are not guaranteed by these sources, the information providers,
or any other person or entity, and may not be complete. From time
to time, reference may be made in our information materials to
prior articles and opinions we have provided. These references
may be selective, may reference only a portion of an article or
recommendation, and are likely not to be current. As markets change
continuously, previously provided information and data may no
be current and should not be relied upon.
321gold Ltd

|
