Investment Scoring & Timing
Newsletter
More Charts! Metals &
US Stocks
Michael Kilbach
Jun 1, 2007
The editorial we published
last week incorporated long term charts for gold, silver and
the Dow Jones Index with a twenty seven year support line. This
week we expand on that same line of thought.
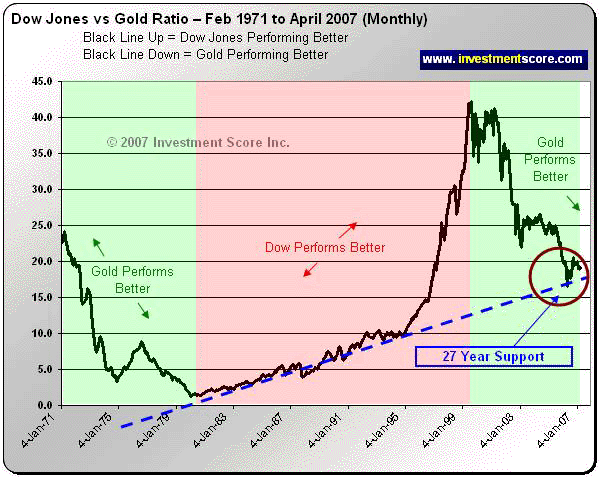
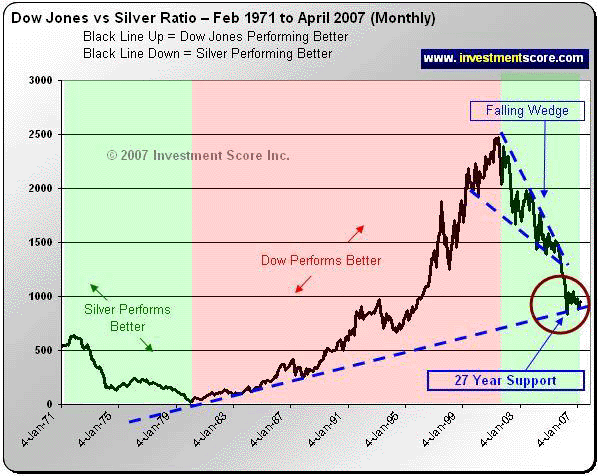
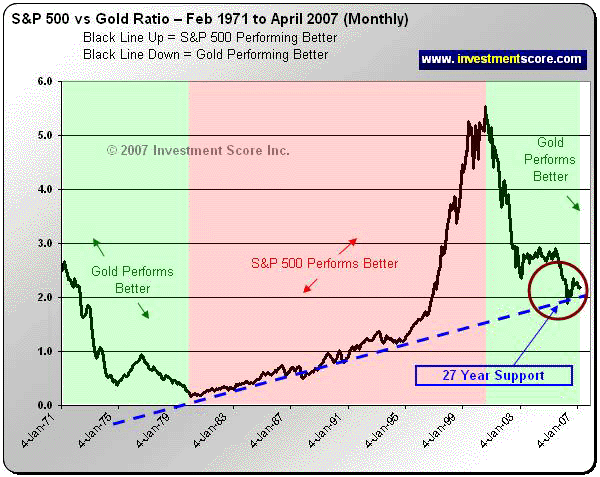
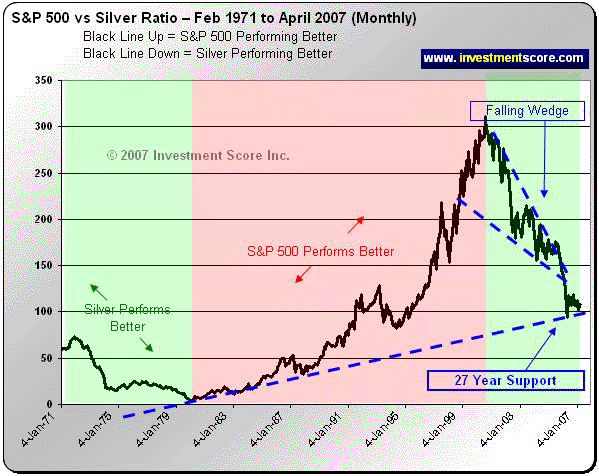
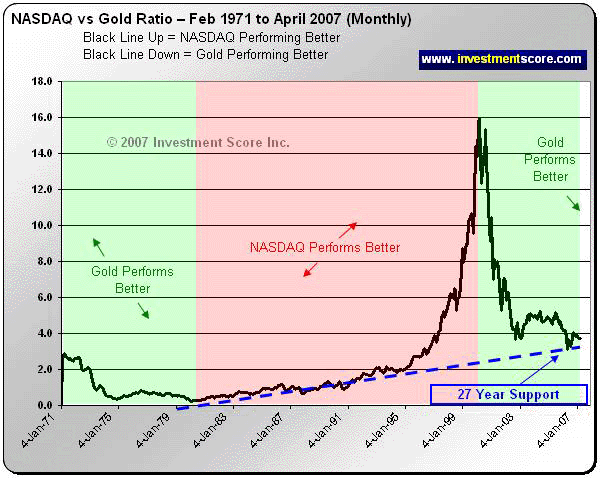
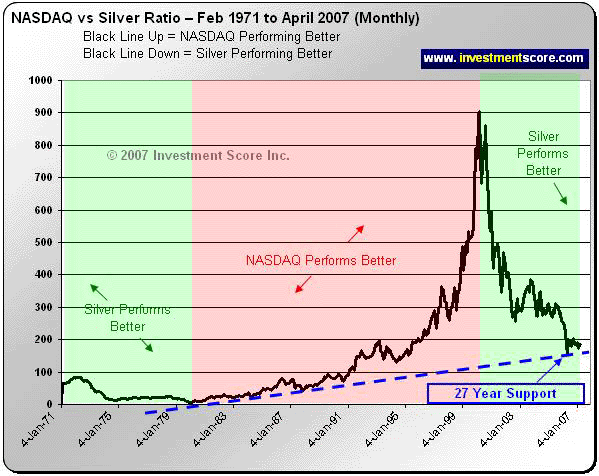
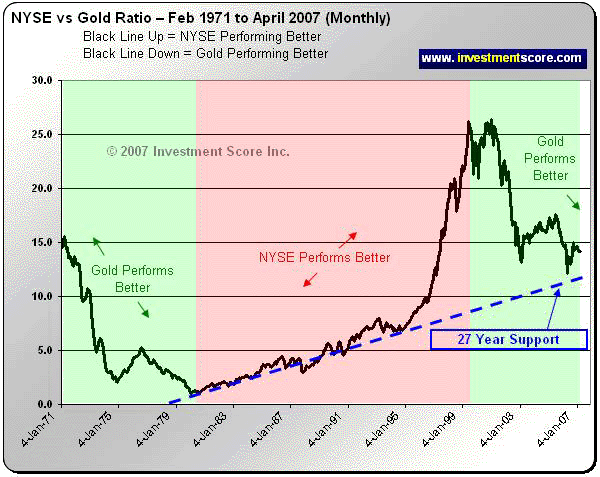
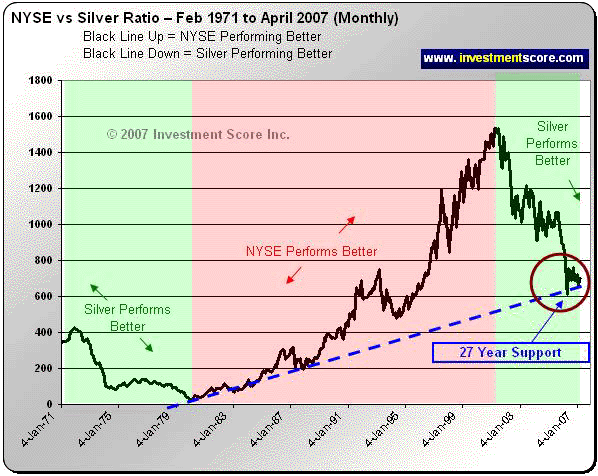
In the above charts you will
notice:
1) Dividing two markets together
to create a ratio helps us determine which market is outperforming
the other market. For example, in the chart above, when the black
line heads higher, the NYSE is outperforming Silver and when
the black line heads lower Silver is outperforming the NYSE.
2) We used several US stock
markets to give an overall picture of what is generally happening
to US stocks when compared directly to silver and gold. Or conversely,
what is happening to silver and gold in comparison to US stock
markets.
3) Each chart has a very long
term support line of about 27 years. In technical analysis support
lines are important as they usually represent key areas of support
and resistance. When the price of a market approaches a support
line it will regularly cause a market to pause or bounce higher.
This support line represents a "line in the sand" where
investors are ready to buy back a market as it hits this key
psychological barrier and possible opportunity to make money.
Often support lines are reached after long, aggressive price
declines are ready for a key point to either rest or bounce off
of it. We believe markets do not move in a straight line and
therefore key turning points such as support lines are often
used for counter rallies.
Also, as a general rule, the
longer the line of support has been in place the more significance
it carries. For example, a support line that has been in place
for a few days is much less important than a support line that
has been in place for a few years or in this case decades.
Additionally, in technical
analysis, once a key support line has been broken that same line
now becomes a line of resistance. What was once an invisible
floor and barrier to the downside now becomes a ceiling and barrier
to the upside. Once a support line is clearly broken the trend
usually continues lower and the new resistance is not easily
broken to the upside.
You may be wondering if these
markets are landing on a key line of support that has existed
for 27 years, why wouldn't these ratios bounce off of this support
and start a new prolonged advance.
In the financial markets anything
can happen. We think that the ratios will likely bounce off of
these key lines of support. In fact you will notice that many
of them have already bounced a few times along the line of support.
But we believe that investing is about probabilities. Based on
our observations of historical major market movements we have
devised a set of guidelines to assist us in our investment decisions.
We believe major market trends are like large swinging pendulums
with huge momentum as massive amounts of capital flow from one
asset class to another. In our opinion one major market trend
will not end until an extreme is met in the direction traveled.
You will notice the major trend from about 1980 to 2000 was for
US stocks to outperform commodities. We now believe that major
trend has reversed and will accelerate when these twenty seven
year support lines are breached.
To help illustrate other key
lines of support we have provided a second set of charts.


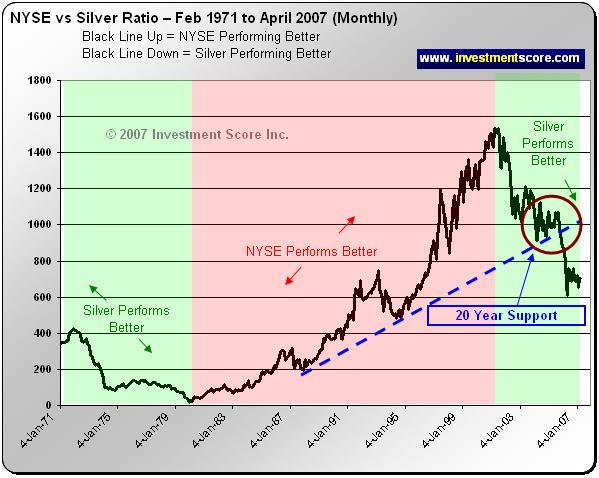
In the above set of charts
you will notice:
1) In most of the charts the
falling ratios paused on the key twenty year support lines. Notice
how many of them bounced for many months as the psychological
barrier held as support for the declining ratio? The support
line was a resistance area but not a launch pad for a new major
advance.
2) In most cases once the support
line is clearly broken that line becomes resistance and the ratio
does not break back through to the upside.
3) The same question asked
about the twenty seven year support line could be asked in regards
to this twenty year support line. If a support line has been
in place for twenty years why wouldn't that line of support hold
and provide a base for a new US equities advance? History now
tells us that the twenty year line of support was merely a place
of rest or support to slow down the ratios decent before it headed
lower to the twenty seven year support lines.
From a very short term perspective,
a stronger stock market with softer, performing commodities is
not a shock to us. After a great start to what we think is a
major commodities bull market, we expect periodic slow downs,
pull backs and breaks. We recognize that markets do not move
in a straight line and expect corrections when market sentiment
and enthusiasm gets overheated. When we keep the big picture
in perspective, our investment decisions become easier and less
stressful. When we look at the long term trends, the day to day
price movements become nearly irrelevant. In the short term we
may be experiencing a strong stock market with weaker commodities,
but in the big picture the trend is clear in our opinion. We
expect the twenty seven year support lines to be breached and
once this occurs, we expect commodities to advance quickly. This
is why we have been positioning ourselves in silver investments.
At www.investmentscore.com
we always keep the big picture in perspective. We do not try
to pick exact tops and exact bottoms of a particular equity or
market. Instead we look at the big picture and use our custom
built timing charts to generally average into the market during
times of pessimism and out of the markets during times of enthusiasm.
We first try to locate major bull markets and identify opportunities
to enter those markets on intermediate pull backs. We use our
timing charts to help us identify the end of this commodities
bull market and then when appropriate enter the next potential
major bull market. You may receive access to our timing charts
by visiting our website and subscribing to our newsletter. Or
you may subscribe to our free newsletter and read free commentary
about our opinion on the markets at www.investmentscore.com.
May 31, 2007
Michael Kilbach
email: mkilbach&investmentscore.com
website: www.investmentscore.com
 Disclaimer/Disclosure: Disclaimer/Disclosure:
No content
provided as part of the Investment Score Inc. information constitutes
a recommendation that any particular security, portfolio of securities,
transaction or investment strategy is suitable for any specific
person. None of the information providers, including the staff
of Investment Score Inc. or their affiliates will advise you personally
concerning the nature, potential, value or suitability or any
particular security, portfolio of securities, transaction, investment
strategy or other matter. Investment Score Inc. its officers,
directors, employees, affiliates, suppliers, advertisers and agents
may or may not own precious metals investments at any given time.
To the extent any of the content published as part of the Investment
Score Inc. information may be deemed to be investment advice,
such information is impersonal and not tailored to the investment
needs of any specific person. Investment Score Inc. does not claim
any of the information provided is complete, absolute and/or exact.
Investment Score
Inc. its officers, directors, employees, affiliates, suppliers,
advertisers and agents are not qualified investment advisers.
It is recommended investors conduct their own due diligence on
any investment including seeking professional advice from a certified
investment adviser before entering into any transaction. The performance
data is supplied by sources believed to be reliable, that the
calculations herein are made using such data, and that such calculations
are not guaranteed by these sources, the information providers,
or any other person or entity, and may not be complete. From time
to time, reference may be made in our information materials to
prior articles and opinions we have provided. These references
may be selective, may reference only a portion of an article or
recommendation, and are likely not to be current. As markets change
continuously, previously provided information and data may no
be current and should not be relied upon.
321gold Ltd

|
