321gold.com
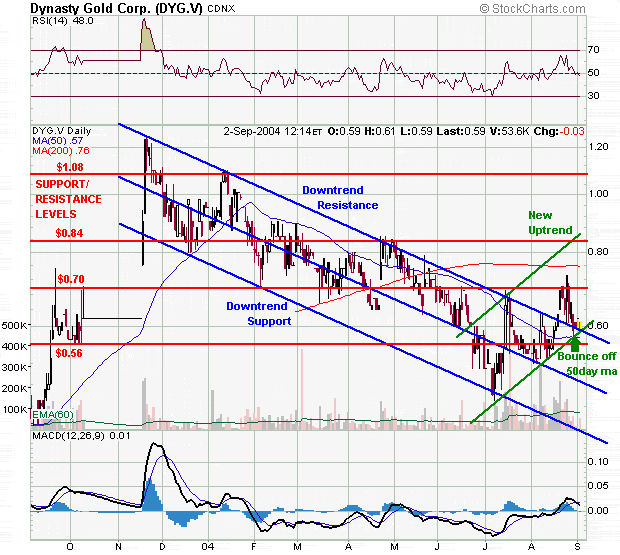
Twenty-First Century DynastyRalph Kettell Dynasty Gold Corp. is a developing story of gold exploration in China. Dynasty is one of only a handful of foreign companies which have been awarded a business license to operate an exploration program or mining operation in China. They have a very large land package of prospective properties in a known mineralized belt in north-western China and are currently working to advance and expand them. On one of the properties, they are currently involved in a large (8000 meter) drill program and the first results were announced on August 24, 2004. Mineralization was encountered in several of the holes, but the most interesting on was hole #ZK421B which encountered 64.7 meters (212 feet) of 5.1 gram/ton (0.18 oz/ton) starting just 24.7 meters (81 feet) below the surface. This is a very significant intercept. While it is not enough to justify a mine by itself, it certainly points to the potential of a near surface bulk mineable heap leach deposit with a low strip ratio. This is a fabulous initial result and hopefully will be augmented by the remainder of this years drilling, the bulk of which is still to be completed. The likelihood is that Dynasty will prove up a 1-2 million oz. gold resource in the next 12 months. Their properties are located in a district which has the potential for several times that amount of gold. What has me currently excited about the company, however, is the technical picture of the stock which is shown on the chart below. The stock had a breakaway gap last October/November when the stock was halted pending the release of news which could have had a material impact on the company's valuation. The stock proceeded to rocket up to a high of $1.24 in mid November. Since then the stock has been in a downtrend on a mission to fill that gap (one of the most basic tenets of technical analysis is that most gaps usually get filled and usually sooner rather than later). Courtesy of a gold share market in full retreat for the past few months, Dynasty not only filled the gap, but it dropped well below it. It ultimately bottomed at around $0.45 in early July. Since then the stock has developed a steep uptrend which is currently intersecting the former downtrend resistance line just below $0.60. Furthermore the stock convincingly broke out of the old downtrend by closing above $0.62 in mid August. Immediately after breaking out, the stock had a mini-gap-up which was filled a couple of weeks later. As is usually the case, when resistance is breached the former resistance line becomes a new support line. This appears to be the case here as well since the stock has just bounced off of it. Another bullish factor is that the stock bounced off the 50 day moving average a few days ago at the same time that the 50 day moving average is turning up.
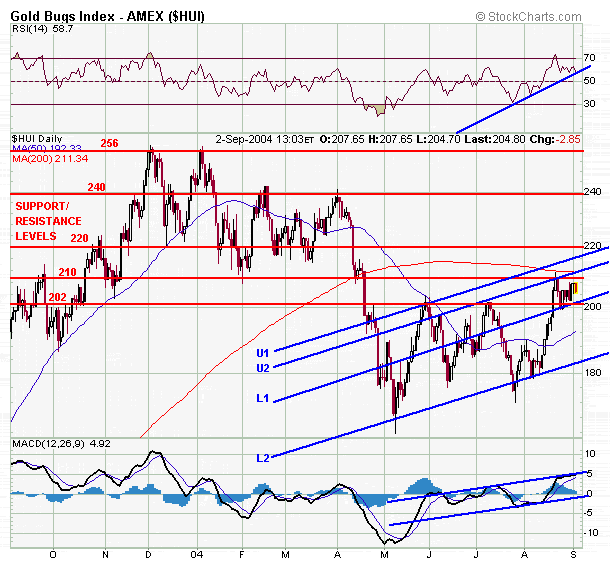
This is one of the lowest risk and also highest reward points on a chart to buy any stock. The stock having broken out and verified support is now ready to run. The resistance levels to watch on this runup are shown on the chart. On the chart, the trajectory of the current uptrend indicates that this stock could double in the next four months. This thesis is also supported by the chart of the Amex Gold Bugs Index HUI, which also recently broke through intermediate term resistance. In mid-August, the HUI broke above the resistance at 202, and within a week it dropped back down to establish the old resistance level as the new support level. Since late April the HUI has been trading in a channel between U1 and L2. The rallies in June and July failed to make it up to the U1 line and ultimately retested L2. It appears that a mid channel line L1 has now been established as the lower bound of the index, and my best guess is that the next rally will break through U2 and re-establish U1 as the resistance line for the up-trend. I would be very surprised, however, if the U1/L1 channel holds for more than a couple of months and look for an upside breakout from that channel before the year ends.
Further bullish signs in the HUI's chart is the action of the moving averages. The 50day ma has convincingly turned up and the 200 day ma is flattening out. If the scenario I have described above comes to pass, then the 50 day ma will cross the 200 day ma (in the bullish direction) in late October. The positive action in Dynasty stock and the coincident bullish pattern in the gold sector seems to indicate an excellent entry point is here to join the coming golden Dynasty.
September 2, 2004 Disclaimer:
The
author's objective in writing this article is to make potential
investors aware of the possible rewards of investing in this
stock and/or warrants and to elicit interest on their part in
this stock to the point where they are encouraged to conduct
their own further diligent research.
Neither
the information, nor the opinions expressed should be construed
as a solicitation to buy or sell this stock. Investors
are recommended to obtain the advice of a qualified investment
advisor before entering into any transactions in the stock. |


 Disclosure:
The author is not an investment advisor and this article
should not be construed as a recommendation to invest in the
discussed securities. The author is merely
presenting some possible scenarios and what the potential risks
and rewards associated with an investment in these securities
could be. The author has not
been paid to write this article, either in cash or securities. The author is a long-term stockholder of
the company and has no plans to sell any of his stock in the
next 1-3 months.