 Special SKI Report #147 Special SKI Report #147
Exact Gold Stock Low?
Jeffrey M. Kern, Ph.D.
Email: jeff@skigoldstocks.com
USERX
| historicals
Written Sunday Dec 28, 2014
Published Dec 29, 2014
Current USERX price = 5.07, Down 20 cents ( another 4%) since the last report 3 weeks ago.
Introduction (repeated from prior Reports):
I have been using my unique SKI indices
to predict price changes in the precious metals' market for more
than two decades. And my indices continue to mark the critical
points. I have initiated a subscription website since 1/13/06
(yes, Friday the 13th) after having posted free updates for years
at www.321gold.com. SKI is a timing service; although
almost everyone seems to believe that market timing is impossible,
that IS what the SKI indices have done for 36 years.
The SKI indices contain short-term (16-20
trading days), intermediate-term (35-39 trading days), and long-term
(92-96 trading days) indices. A more comprehensive description
of these mathematical indices and their history is found here.
Basically, the indices compare today's price to prices from a
specified prior time period. The name of the index specifies the
time period (e.g., 92-96 index = compare today's price to prices
from 96, 95, 94, 93, and 92 trading days earlier). Although I
use the oldest gold mutual fund, USERX, for analyses, the predictions
are applicable to the broad precious metals' market. I do not
recommend or analyze specific stocks, but my subscribers from
around the world regularly discuss individual issues on our Forum.
In addition to the truly unique SKI indices, I also use "run
patterns" to guesstimate turning points in the precious metals'
market. A "run" refers to a pattern of daily up and
down market closing prices. If the market has 3 consecutive days
of higher closing prices, the run is "3 up". If prices
then decline for 2 consecutive days, the run becomes "3 up
and 2 down". If prices then close higher the next day, the
run changes to "2 down and 1 up". Some people have referred
to run patterns as "worms". A run pattern is only completed
after the direction of closing prices has changed. I have compiled
a listing of every run pattern that has ever occurred and generated
probabilities that the end of the run marks a high or a low, moderated
by the indices themselves.
New Material
The last gold stock SKI Report, written on Sunday 12/07/2014, did not predict a direction, but noted that the 16-20 index resistance had been holding since it was first hit/touched on 11/21/14 at USERX 5.68 and since its sell signal on the 12/01/14 rise at USERX 5.45. The Report concluded that IF the gold stocks declined, “A further decline will yield a supportive/buyable 16-20 index buy signal during this coming week”.
The prior public SKI Report, on November 16th, concluded with the thought that the gold stocks might need to plunge via a specific and historic run pattern (a “Life Run Low”), before making a final multi-year bottom. That run pattern is 2 Up and 5+ strong Down days averaging more than a 2% USERX decline per day.
After the 12/07/14 321gold Report, the gold stocks took 7 trading days, as opposed to “one week”, to plunge below the 16-20 index’s back prices. The index generated its buy signal on 12/15/14 (that’s mathematical verifiable) for execution on 12/16/14 (the day before the U.S. Federal Reserve announcement).
Interestingly, that plunge to a new multi-year low in USERX and GDXJ, on 12/16/14, formed the historically significant 2 Up and 5 strong Down run pattern (look at a chart for verification). Remember, the GDXJ Death Run top in 2011 marked the multi-year high via a 2 Up and 5 strong Down day run at a multi-year high. Now GDXJ, after having risen for 2 consecutive days, plunged 20% over 5 trading days into a multi-year low (going below the 11/05/14 low).
Conclusion: I’m being brief because the information is rather “clear”. Mechanical SKI and Jeff are long the gold stocks as of 12/16/14. The simultaneous index buy signal and “special” run pattern are extremely rare and may have marked the exact multi-year low in the gold stocks. They clearly were supposed to mark “some type of low”. That low can be THE final multi-year low, but the important information is that the SKI indices should/will provide a sell-stop. Although SKI is clearly bullish, if the sell-stop is activated (at a gain or a loss), Jeff can write the rather rare definitive statement that another major decline will follow.
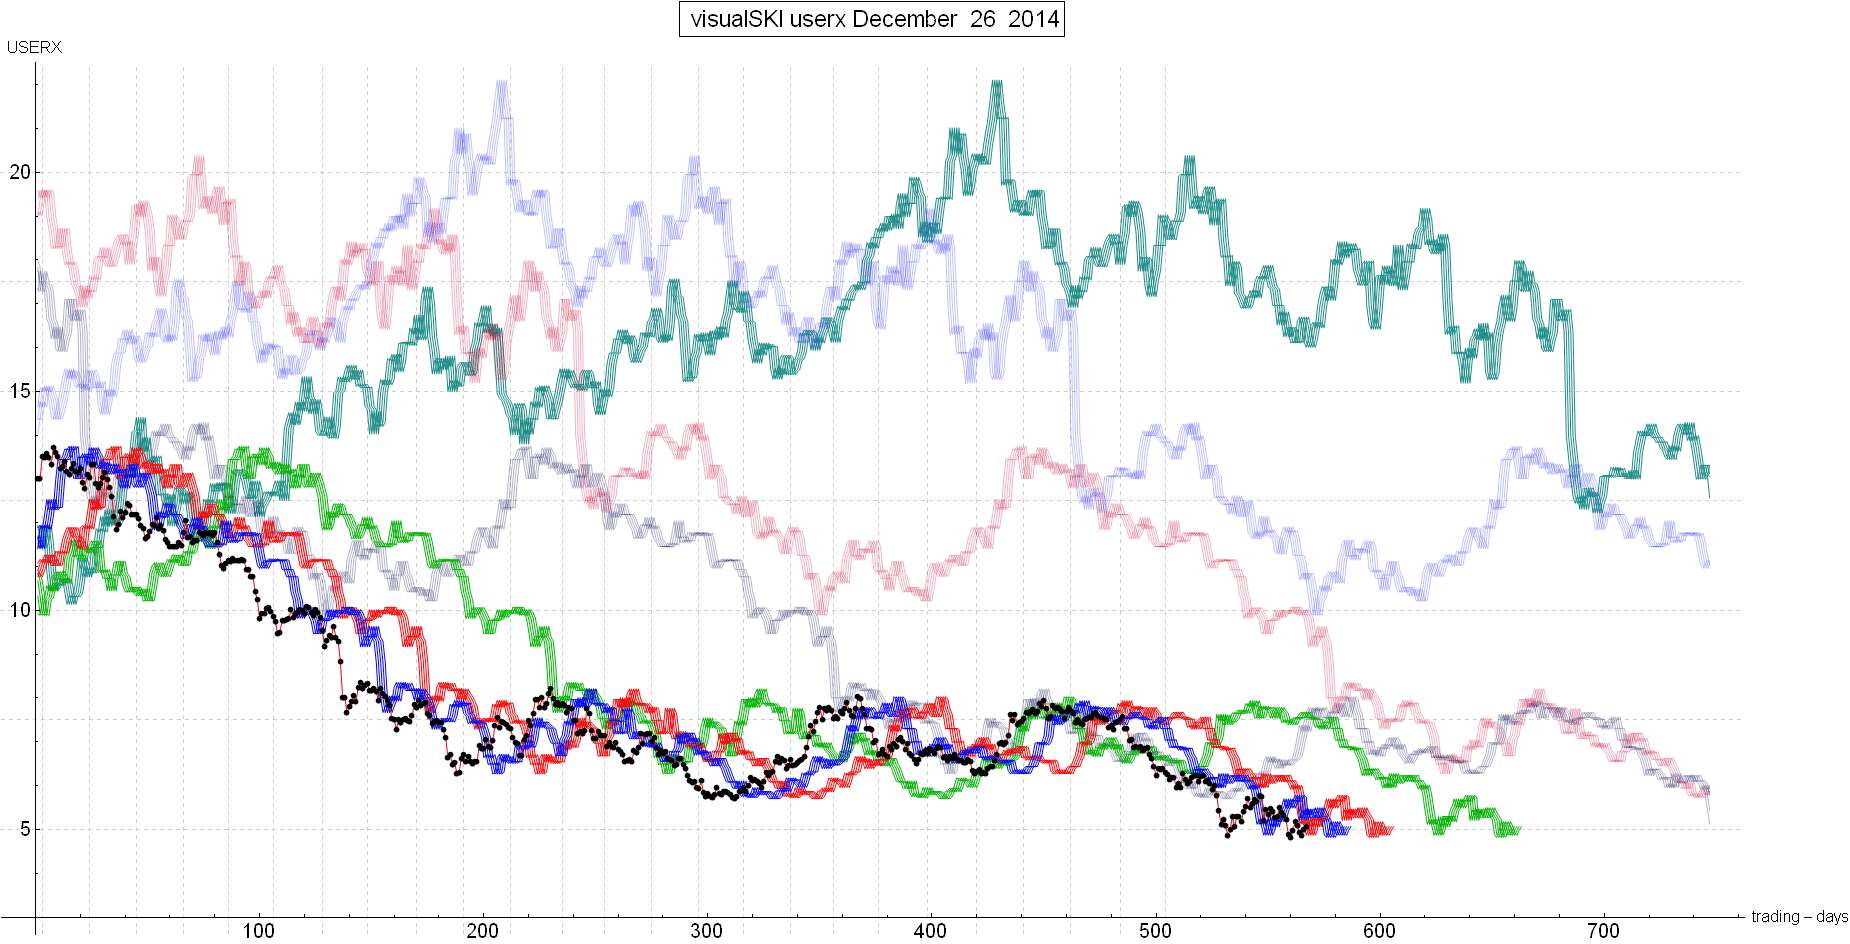
In the spirit of the holidays, the following USERX SKI chart is presented here. You should be able to see how USERX rose up to the blue 16-20 index resistance index line to stop the rise from November 5th and then plunged below the blue line on 12/15/14 for the 12/16/14 buy signal. Now the gold stocks have risen 5% from the 12/16/14 low and have reached the next index (the red line 35-39 index). The bullish upside target is the declining green line (quite a rise), but a decline below the red line should (and I can state 99% “will”) yield another major decline. SKI and Jeff are quite bullish, but please do not ignore the sell stop.
This could be a major SKI Report, as per the one that reported on the 2011 Death Run tops in GDXJ and SLV….
Best Wishes for the Holiday Season and the New Year, Jeff
If you are interested in following and learning more about the SKI indices, I'll write another Report in three weeks or you can shell out the big bucks for a SKI subscription. Weekly Updates are available by subscribing for a month (or longer if you're wise and cheap enough to want to save money) at my website www.skigoldstocks.com for the princely sum of $25 (for a one month subscription) or more ($200 for an annual subscription). I also provide more frequent intra-week messages/alerts at a slightly higher price along with access to our informative Forum and a managed gold futures program. The precious metals are in a very long-term (decade+) up-trend but are the most precarious, volatile, and psychologically difficult market in the world (in my opinion). That's the way it's always been.
###
 SKI archives SKI archives
email: jeff@skigoldstocks.com
Jeffrey M. Kern,Ph.D., is an academic psychologist with a specialty in the measurement and prediction of human behavior. The communications provided are for informational purposes only and are not intended to be investment advice or recommendations for specific investment decisions. Dr. Kern is not a registered investment advisor, but is registered as a commodity trading advisor (CTA). The information provided is considered accurate, but cannot be guaranteed. Investments/trading in narrow market segments or gold futures is for individuals willing to accept a higher level of risk for the opportunity of greater returns. Past performance is no guarantee of future performance. His website is www.skigoldstocks.com.
Communications should be sent to: jeff@skigoldstocks.com.
Copyright © 2002-2024 Jeffrey Kern. All Rights Reserved.
321gold Ltd

|
